
[Founder Securities] The "Tide" Factor: Extracting Alpha from Intraday Volume Microstructure
2022-05-08_方正证券_多因子选股系列研究之二:个股成交量的潮汐变化及“潮汐”因子构建
This paper introduces the "Tide" factor framework, a novel intraday volume-based quantitative strategy. By identifying daily "high tide" (peak volume) and "low tide" (trough volume) phases, the authors construct a "Complete Tide" factor that captures alpha from price overreactions during periods of intense trading activity.
TL;DR
In the stock market, volume is the engine of price movement. This report by Founder Securities proposes the "Tide" (潮汐) factor, which treats the intraday rise and fall of trading volume as a biological rhythm. By analyzing price velocity during these "Tide" cycles, the researchers identified a powerful mean-reversion signal. The resulting "Complete Tide" factor achieves an impressive Information Ratio of 3.08 and an 83.96% monthly win rate, proving that how volume flows within a day is just as important as the total volume itself.
Background & Motivation: Beyond Daily Aggregates
Most quantitative factors view volume as a daily sum. However, a 240-minute trading day is far from uniform. There are "high tides" where the market is surging with activity and "low tides" of quiet contemplation.
The authors' core Insight is based on behavioral finance:
- Panic Selling: Rapid price drops during high-volume "tides" indicate excessive pessimism, leading to overreaction and potential future rebounds.
- FOMO Buying: Rapid price spikes during these tides indicate excessive optimism, leading to overextended valuations.
By quantifying the "velocity" of price change during these specific liquidity cycles, one can capture the exact moments of market inefficiency.
Methodology: Mapping the "Tide"
The construction of the factor follows a rigorous four-step process:
1. Defining the Tide Cycle
The researchers use "Neighborhood Volume" (a 9-minute rolling sum) to identify the intraday "Peak Moment" (t). They then look for the "Flowing Tide" (start) and "Ebbing Tide" (end) points by finding local volume minima before and after the peak.
2. Decomposing Energy (Strong vs. Weak)
Not all tides are equal. The authors introduce a "Half-Tide" decomposition:
- Strong Half-Tide: The phase with the larger volume gap (from start to peak or peak to end). This represents the highest "energy" and information density.
- Weak Half-Tide: The more stable, preparatory or closing phase.
3. Price Velocity Calculation
The factor is defined as the average price change rate per minute during these phases over the past 20 trading days:
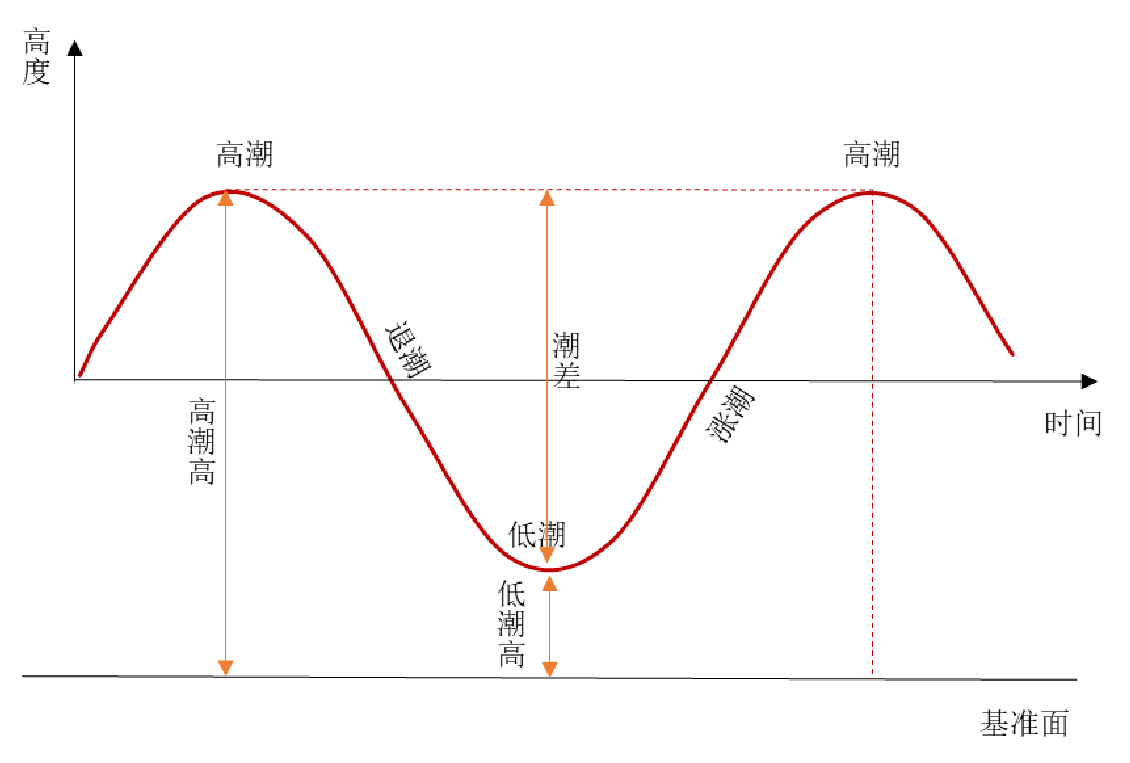 Figure: The structural definition of a volume "Tide" cycle.
Experiments & Results: Robust Alpha
The "Complete Tide" factor (equal weight of Strong and Stable Weak phases) underwent rigorous backtesting (2013-2022) across the Chinese A-share market.
SOTA Performance
- Rank IC: -7.90% (Strong negative correlation indicates high predictive power for mean reversion).
- Annualized Long-Short Return: 27.09%.
- Sharpe/Information Ratio: 3.08.
The factor performs exceptionally well in the CSI 1000 (Small caps), where liquidity imbalances are more frequent, yielding a long-only excess return of 13.01%.
 Table: Annual performance of the Complete Tide factor groups.
Style Neutralization (Ablation)
A common critique of volume factors is that they merely proxy for Volatility or Turnover. The authors performed "Orthogonalization" to strip away these influences. The resulting "Pure" factor still maintained a Rank IC of -3.47% and an IR of 2.53, confirming that the "Tide" structure provides unique alpha.
Critical Analysis & Conclusion
Takeaway
The "Tide" factor succeeds because it focuses on the marginal change in volume. It captures the "exhaustion" of buyers and sellers during peak liquidity events.
Limitations
- Implementation Shortfall: High-frequency intraday signals may face decay if execution is delayed.
- Market Regime Risk: In extremely trending markets (strong bull/bear), the mean-reversion logic of the Tide factor might face short-term drawdowns.
Future Outlook
This framework opens the door for "Volume Morphology"—using neural networks (like CNNs or Transformers) to identify more complex intraday volume "shapes" that signal institutional accumulation or distribution.