
Beyond the Check-in: Inferring Event Attendance from Non-Geotagged Social Media
3005_Exploring Social Media for Event Attendance.
This paper introduces a machine-learning approach to infer user attendance at large-scale events (e.g., music festivals) by analyzing non-geotagged social media posts. Using a multi-dimensional feature set across textual, temporal, social, and multimedia data, the authors achieve up to 87% accuracy in identifying attendees on Twitter datasets.
TL;DR
Researchers have developed a machine learning framework that can accurately predict whether a user actually attended a major event—like a music festival—without needing GPS or geotagged data. By analyzing the "echo" of an event through text, social patterns, and multimedia links, their models achieved up to 87% accuracy, proving that behavior often speaks louder than coordinates.
The "2%" Problem: Why GPS is Not Enough
In the world of social media analytics, "location" has long been the gold standard for verifying attendance. If a user tweets from the coordinates of a stadium, they are likely there. However, there is a massive catch: only about 2% of tweets are actually geotagged.
Relying solely on GPS data creates a "sparsity trap," where 98% of the audience's behavior remains invisible to mobility managers and advertisers. The authors of "Exploring Social Media for Event Attendance" set out to bridge this gap by asking: Can we identify an attendee solely by the way they talk and interact during the lifecycle of an event?
The Three Phases of Attendance
The study breaks down attendance into a temporal journey, recognizing that the "vibe" of a post changes based on when it is published:
- Before: Expressions of intent, ticket purchases, and anticipatory excitement.
- During: Real-time feelings, reporting issues, and sharing "in-the-moment" photos.
- After: Nostalgia, photos of the past experience, and claims of "I'll be back next year."
The Feature Matrix
To capture these nuances, the team didn't just look at words (Textual). They looked at:
- Social Metrics: The ratio of followers to followees (helps filter out news bots and sponsors who talk about the event but don't attend).
- Multimedia: Links to Instagram or Facebook which often host the actual visual proof of presence.
- Temporal Distance: How close the post is to the event's start or end date.
Cracking the Code: GBDT and Feature Importance
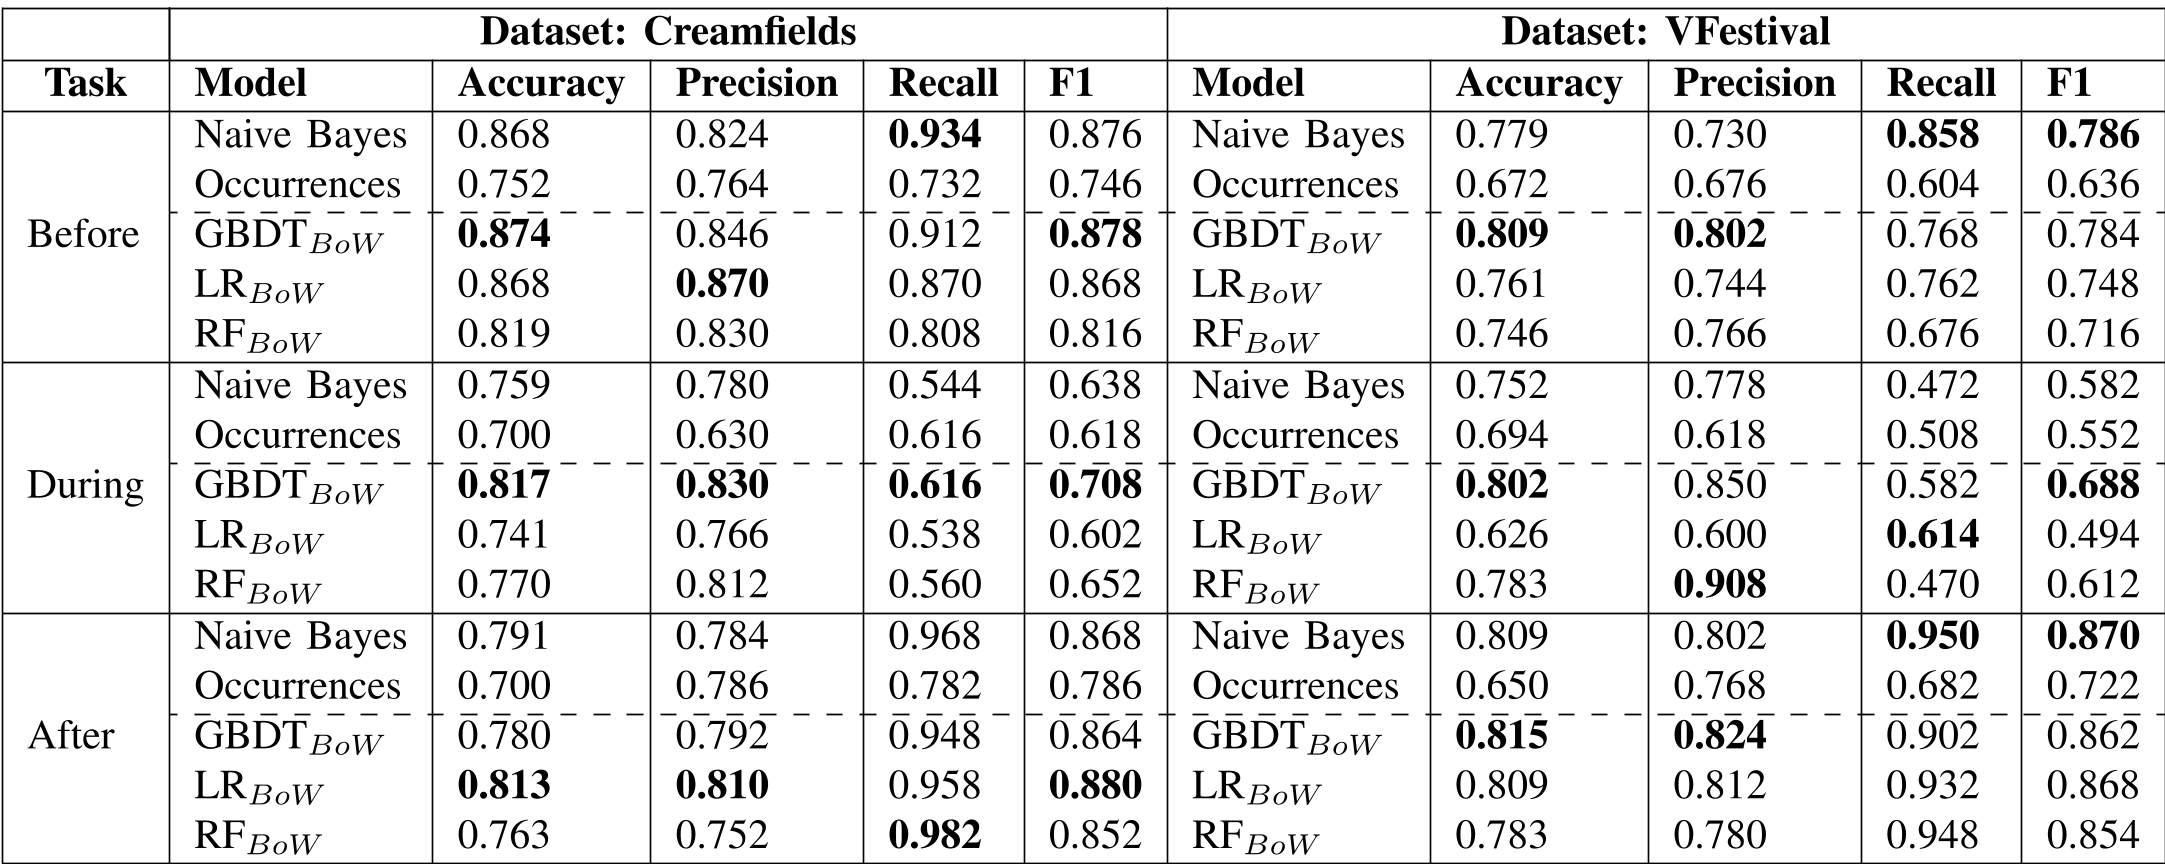
The researchers tested three main models: Gradient Boosting Decision Trees (GBDT), Logistic Regression (LR), and Random Forest (RF) against two UK festivals, Creamfields and VFestival.
Key findings from the experiments include:
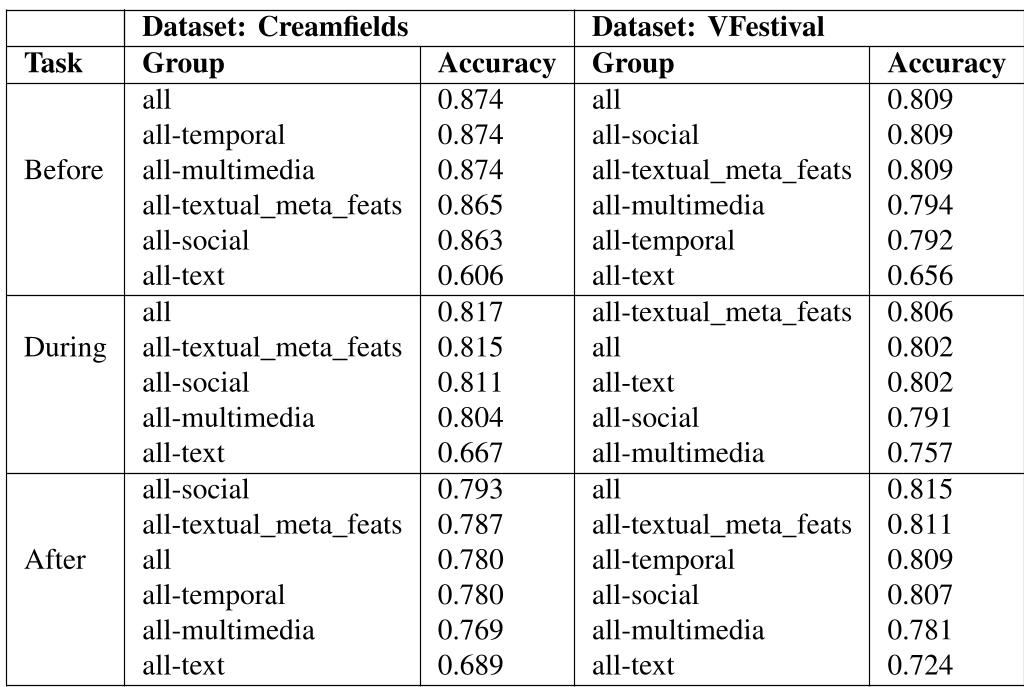
- Text is King (Mostly): For "Before" and "After" tasks, the Textual features (specifically unigrams/bigrams) were the most vital. Removing them caused the accuracy to plummet.
- Multimedia is the "During" Signal: During the festival, the presence of photos or video links became a much stronger signal of actual attendance than text alone.
- Precision vs. Recall: Logistic Regression proved exceptionally good at "Precision" (ensuring that those predicted to attend were definitely there), while Random Forest showed high "Recall" for the VFestival (finding almost every single attendee).
Critical Insight: The Social Filter
One of the most clever aspects of this methodology is the use of the Social Ratio. By identifying that users with high follower counts but low followee counts are likely "echoing" the event for commercial reasons rather than attending, the researchers successfully filtered out the "noise" of advertisements and ticket resellers. This demonstrates a deep understanding of the social graph's role in verifying physical reality.
Conclusion & Future Horizons
This work demonstrates that our digital footprint—even without a literal map marker—is highly predictive of our physical movements.
Limitations: The study relies on manually labeled ground truth, which is labor-intensive. Looking Ahead: Future iterations could leverage Large Language Models (LLMs) to perform zero-shot classification on this text, potentially reaching even higher accuracy without the need for extensive training sets. For urban planners and event organizers, this opens a new window into understanding crowd dynamics through the lens of shared human experience.