
The Power of Proximity: How Neighborhood Networks Control the Speed of Innovation
3972_Modelling and analysis of rainwater harvesting technology disseminating process based on Social Networks Threshold approach.
This study investigates the diffusion of innovations within social networks, specifically focusing on how structural thresholds and neighborhood network dynamics influence the adoption of new practices. The research utilizes longitudinal data (2004-2007) across multiple neighborhoods to map the progression from early adopters to laggards, achieving a comprehensive multi-level analysis of system-wide vs. local network effects.
TL;DR
Why do some innovations catch fire in one street but die out in the next? This research dissects the longitudinal diffusion of practices across eight distinct neighborhoods. By tracking adoption from 2004 to 2007, it reveals that the "Late Majority" represents the real battleground for system-wide change, and that geographical "neighborhood networks" often act as gatekeepers that either accelerate or stifle the influence of the broader system.
The "Threshold" Problem: Why Good Ideas Fail
In social science, the Threshold Model suggests that an individual adopts an innovation only after a certain proportion of their peers have done so. However, prior work often ignores that we live in two worlds simultaneously: our immediate physical neighborhood and the wider professional or social system.
The motivation behind this study is to understand the friction between these two layers. Why does a "Low Threshold" individual in a "High Threshold" neighborhood fail to adopt? The researchers hypothesize that the interplay between local ties and external exposure (represented by city visits) determines the rate of contagion.
Methodology: Mapping the Social Fabric
The study categorized the population into a matrix of System Networks (Adopter Categories) and Neighborhood Networks (Threshold levels).
1. Longitudinal Tracking
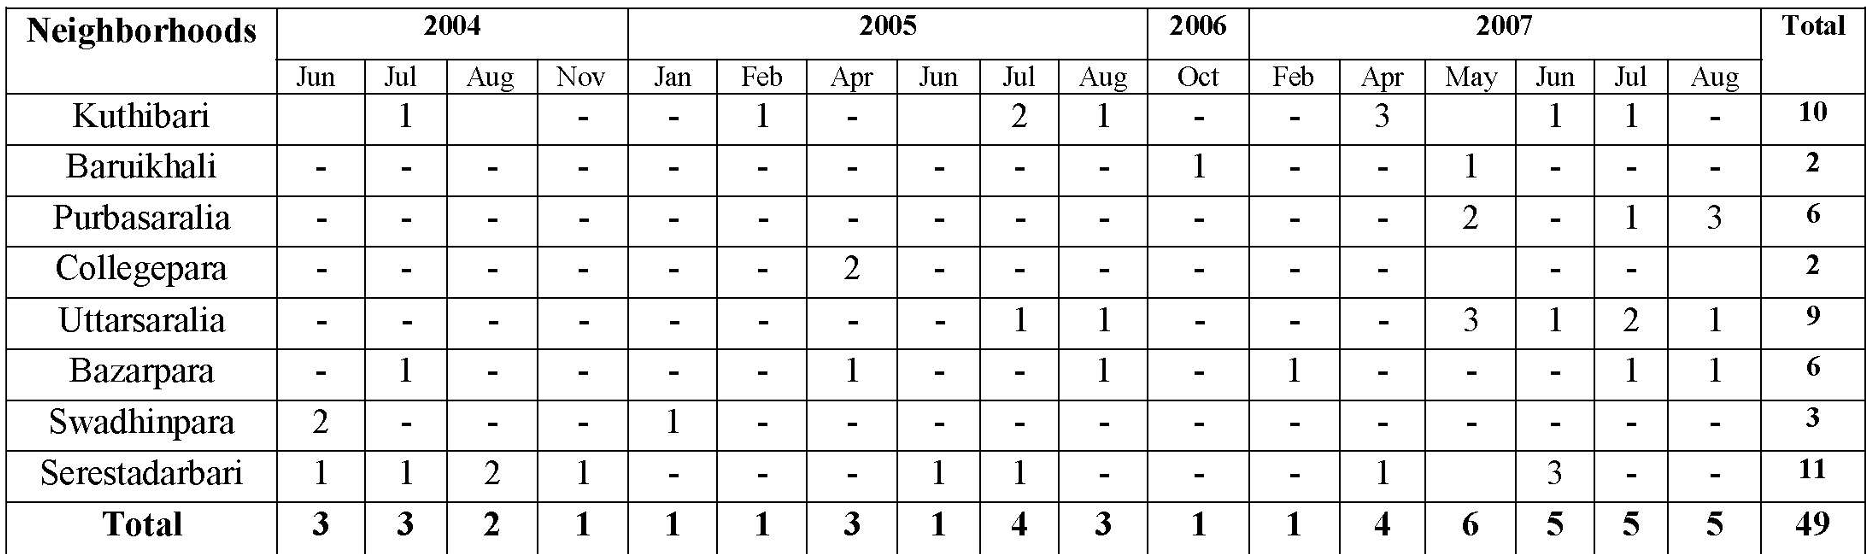
The study monitored dozens of cases across neighborhoods like Kuthibari, Uttarsaralia, and Serestadarbari. As shown in the temporal distribution table, adoption wasn't a single burst but a series of clusters, peaks, and lulls over three years.
2. Multi-Level Network Analysis
By crossing "Early Adopters" with "Neighborhood Thresholds," the authors could see if early adopters were isolated or if they lived in specifically receptive environments.
Key Insights: Mobility as a Catalyst
The research found a significant correlation between mobility (City visits) and the speed of adoption.
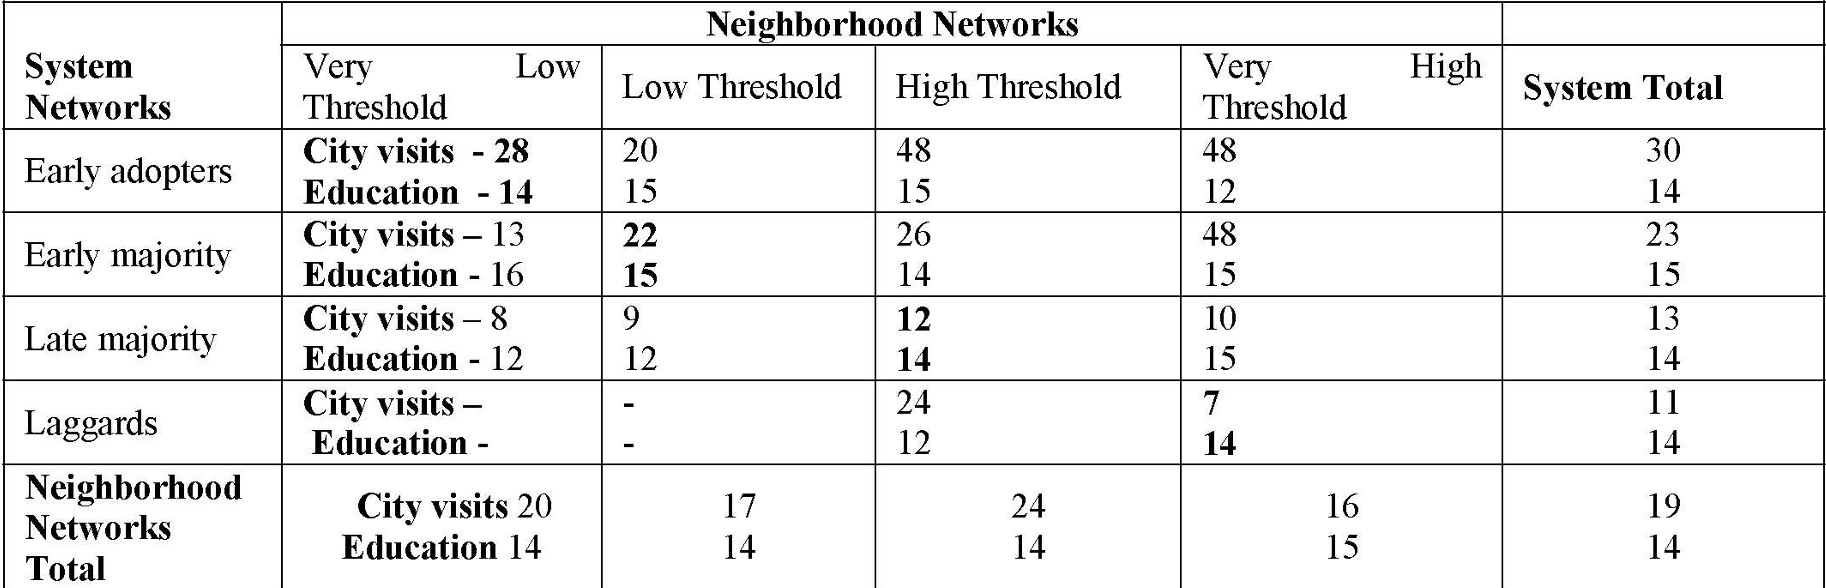
- The Mobility Gap: Early adopters in "Very High Threshold" neighborhoods still had high city visit rates (48), whereas laggards in similar neighborhoods had minimal external contact (11).
- Education's Ceiling: Interestingly, education levels were surprisingly consistent across the groups (averaging 14 years), suggesting that social connectivity and geographic exposure are more powerful drivers of change than formal education alone in these specific network contexts.
Experiments and Statistical Distribution
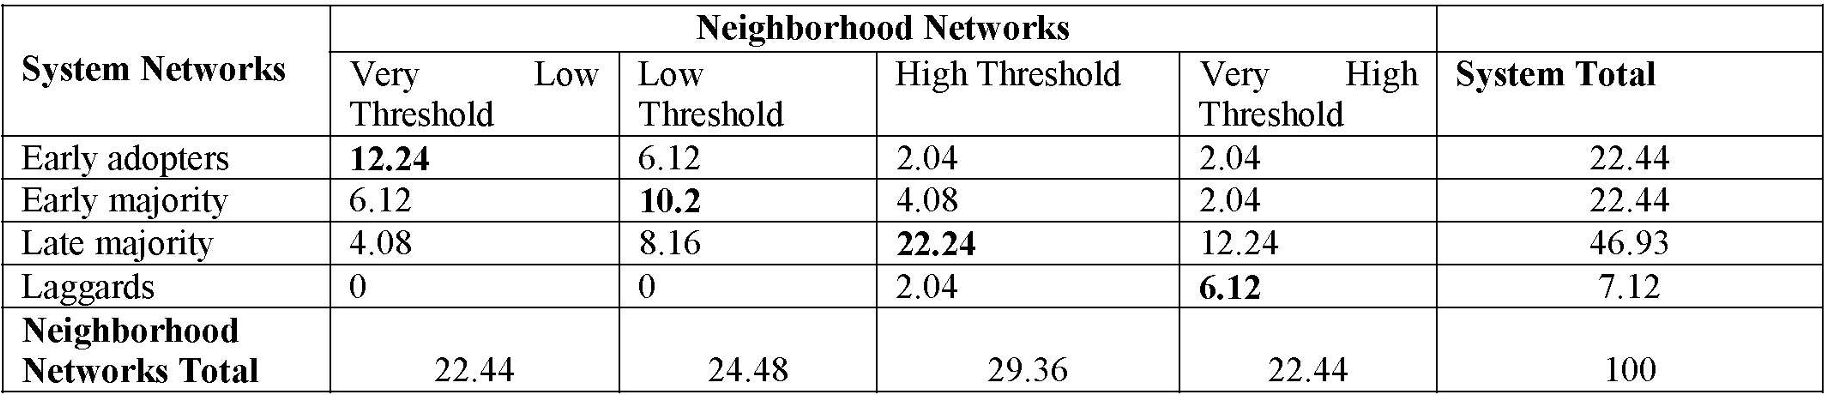
The final distribution of the network (after the 3-year period) shows that while the "Early Adopters" (22.44%) start the fire, the "Late Majority" (46.93%) defines the success of the diffusion. Most of this Late Majority resides in "High Threshold" neighborhood networks, meaning they require significant local proof before committing to a change.
Critical Analysis & Conclusion
Takeaway
The study proves that geography is destiny in the world of social diffusion. Even if an individual is predisposed to change (low threshold), being embedded in a resistant neighborhood (high threshold) creates a "structural lag." To break this lag, "City Visits"—or bridges to external networks—are the most effective tool.
Limitations
The study relies on a relatively specific geographic context. It doesn't fully account for digital networks, which in 2026, often override physical neighborhood boundaries. Furthermore, the "innovation" being adopted isn't explicitly defined in these tables, though the mechanics of the network remain theoretically sound.
Future Outlook
For policymakers or marketers, this suggests that the "Late Majority" shouldn't be targeted with general education, but rather with strategies that increase their local neighborhood density of adopters—turning a "High Threshold" environment into a "Low Threshold" one through physical proximity.