
MatrixExplorer: Bridging the Gap Between Matrices and Node-Link Diagrams in Social Science
515_seaux sociaux.
This paper introduces MatrixExplorer, an integrated system for exploratory social network analysis that combines matrix-based views and node-link diagrams. Designed specifically for social scientists, it emphasizes an iterative workflow that leverages the scalability of adjacency matrices and the intuitive nature of graph drawings to uncover complex social structures.
TL;DR
MatrixExplorer is a pioneering system designed for social science researchers that harmonizes the high-density information of adjacency matrices with the intuitive structural layouts of node-link diagrams. By prioritizing an iterative workflow and interactive reordering, it allows users to navigate large, messy social networks without losing sight of the underlying data.
The "Hairball" Problem and the Matrix Intuition
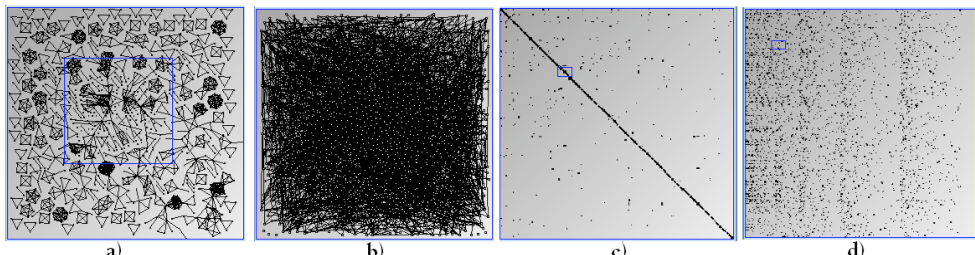
In the world of Social Network Analysis (SNA), we are often captivated by node-link diagrams—those beautiful webs of dots and lines. However, for experts like sociologists and historians, these diagrams often fail. As networks grow, edges overlap in an illegible mess known as the "hairball" effect.
The authors argue that Adjacency Matrices are arguably the most powerful yet underutilized tool for exploration. Why?
- No Occlusion: Even in a dense graph, every "non-relationship" is visible as an empty cell.
- Stability: Unlike force-directed layouts that "wiggle" and change every time you run them, a matrix provides a stable coordinate system.
- Scalability: Matrices perform significantly better for low-level tasks (finding nodes, determining connectivity) once the node count exceeds 20.
Methodology: The Workflow of Discovery
MatrixExplorer’s core philosophy is that exploration is not a one-step process. It follows a deliberate pipeline:
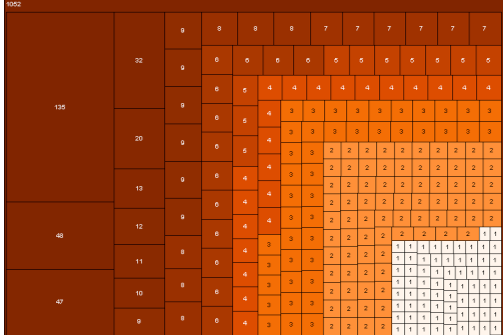
1. The Macro View (Treemaps)
Before diving into individual nodes, the system uses a Treemap to visualize connected components. This helps the researcher immediately see if they are dealing with one giant component or several isolated "islands" of social activity.
2. Interactive Matrix Reordering
A raw matrix is just a random grid. The "magic" happens when you reorder the rows and columns. MatrixExplorer provides several ways to do this:
- Automatic Algorithms: Using solutions derived from the Traveling Salesperson Problem (TSP) and Hierarchical Clustering to group similar actors together.
- Manual Tweak: Users can "drag and drop" rows to test hypotheses.
- Attribute Sorting: Sorting rows by name while sorting columns by "degree" (connectedness) to find outliers.
3. The Synchronization of Views
The system maintains a dual-view environment. When a user selects a "cluster" in the matrix (appearing as a solid block of color), that same group is highlighted in the node-link view. This allows the researcher to enjoy the structural clarity of the matrix while seeing the topological "neighborhoods" in the graph.
Identifying Success: The Consensus Approach
One of the unique features of MatrixExplorer is the Consensus tool. In social science, "truth" is often subjective. Researchers may find a group using one algorithm but lose it using another. MatrixExplorer allows users to save clusters and "confront" them across different representations. If a group of students remains a tight block regardless of how the matrix is reordered, the researcher can be confident the community is real.
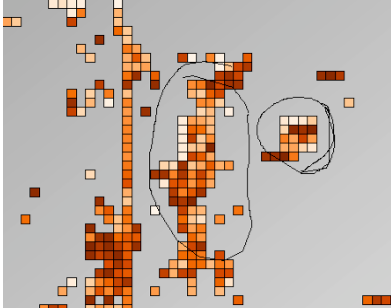 Figure: Confronting different reorderings to find stable social clusters.
Critical Insight: Beyond Topology
What sets MatrixExplorer apart from "push-button" graph tools like GraphViz is its focus on Information Visualization (InfoVis) rather than just Graph Drawing. It doesn't treat actors as mere dots; it treats them as entities with age, gender, and roles. By allowing users to map these attributes to visual variables (cell color size), the matrix becomes a rich, multi-dimensional spreadsheet.
Conclusion & Future Outlook
MatrixExplorer serves as a reminder that the most "intuitive" visualization (node-link) is not always the most "effective" for analysis. By starting with the matrix and using the node-link diagram as a secondary, simplified summary, researchers can avoid the pitfalls of visual clutter.
Limitations: At the time of writing, the system was still finalizing "aggregation" features (collapsing a cluster into a single node), which is essential for massive datasets involving thousands of actors.
Future Work: The authors suggest that adding animation—transitioning smoothly between the matrix and the graph—could help researchers transition their mental models more effectively.