
Beyond the Buzz: Decoding the Hidden Mechanics of Viral Social Media
5907_Identifying dynamics and collective behaviors in microblogging traces.
Identifying Dynamics and Collective Behaviors in Microblogging Traces introduces a framework to distinguish "causes" (user interactions) from "effects" (raw volume trends) in social media. By combining dynamic graphs with 10-dimensional time-series and a heterogeneity-aware distance metric, the authors achieve SOTA performance in automatically identifying complex social patterns like viral marketing and social activism.
In the world of microblogging, we often focus on what is "trending." We see a hashtag explode or a piece of news go viral, visualizing it as a simple spike in a volume chart. However, as Huan-Kai Peng and Radu Marculescu argue in their seminal work, looking only at the volume is like looking at a shadow without seeing the object casting it.
TL;DR
This paper shifts the focus from Usage Dynamics (the "effect") to Collective Microblogging Dynamics or CMD (the "cause"). By building dynamic social graphs and extracting 10-dimensional time series, the authors show how to differentiate between breaking news, paid advertisements, and organic social movements—even when their volume charts look identical.
The "Cause vs. Effect" Problem
Most prior research treated Twitter trends as 1D time-series data. The authors demonstrate the fatal flaw in this approach using two events: hospital (news of Michael Jackson’s death) and theonlinemom (a parenting discussion).
Both show a "twin peak" pattern. However:
- Hospital was driven by propagation retweets from new users (viral spread).
- Theonlinemom was driven by repetitive interactions between the same set of users (community discussion).
If you only look at the volume, you miss the sociology. To solve this, the authors propose a framework that captures the who and how behind the when.
Methodology: The Dynamic Graph Framework
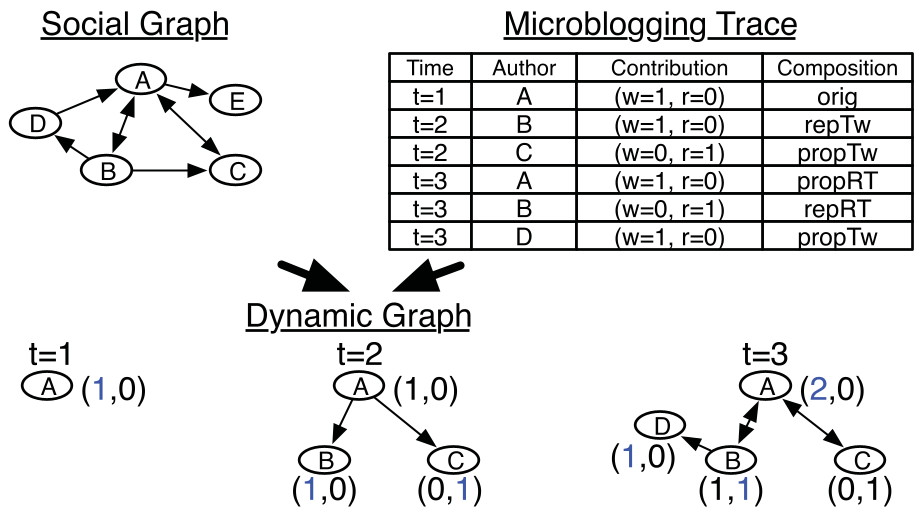
The core of the methodology is the construction of a Dynamic Graph that evolves over time.
1. Representation
For every event (e.g., a bursty keyword like "IranElection"), the authors track 10 specific signals:
- Composition Series: Original tweets, propagation tweets/retweets, and repetitive tweets/retweets.
- Community Series: Graph metrics including diameter, average path length, and the size of the Largest Connected Component (LCC).
2. The Heterogeneous Distance Metric
Comparing two events isn't as simple as calculating Euclidean distance. The authors developed a metric that is:
- Lag-invariant: Two events might have the same "shape" but start at different times.
- Scale-invariant: A small interest group's interaction pattern might be identical to a massive one.
- Heterogeneity-aware: It balances the importance of rare events (like repetitive posts) against high-volume ones.
Prototypes of Social Behavior
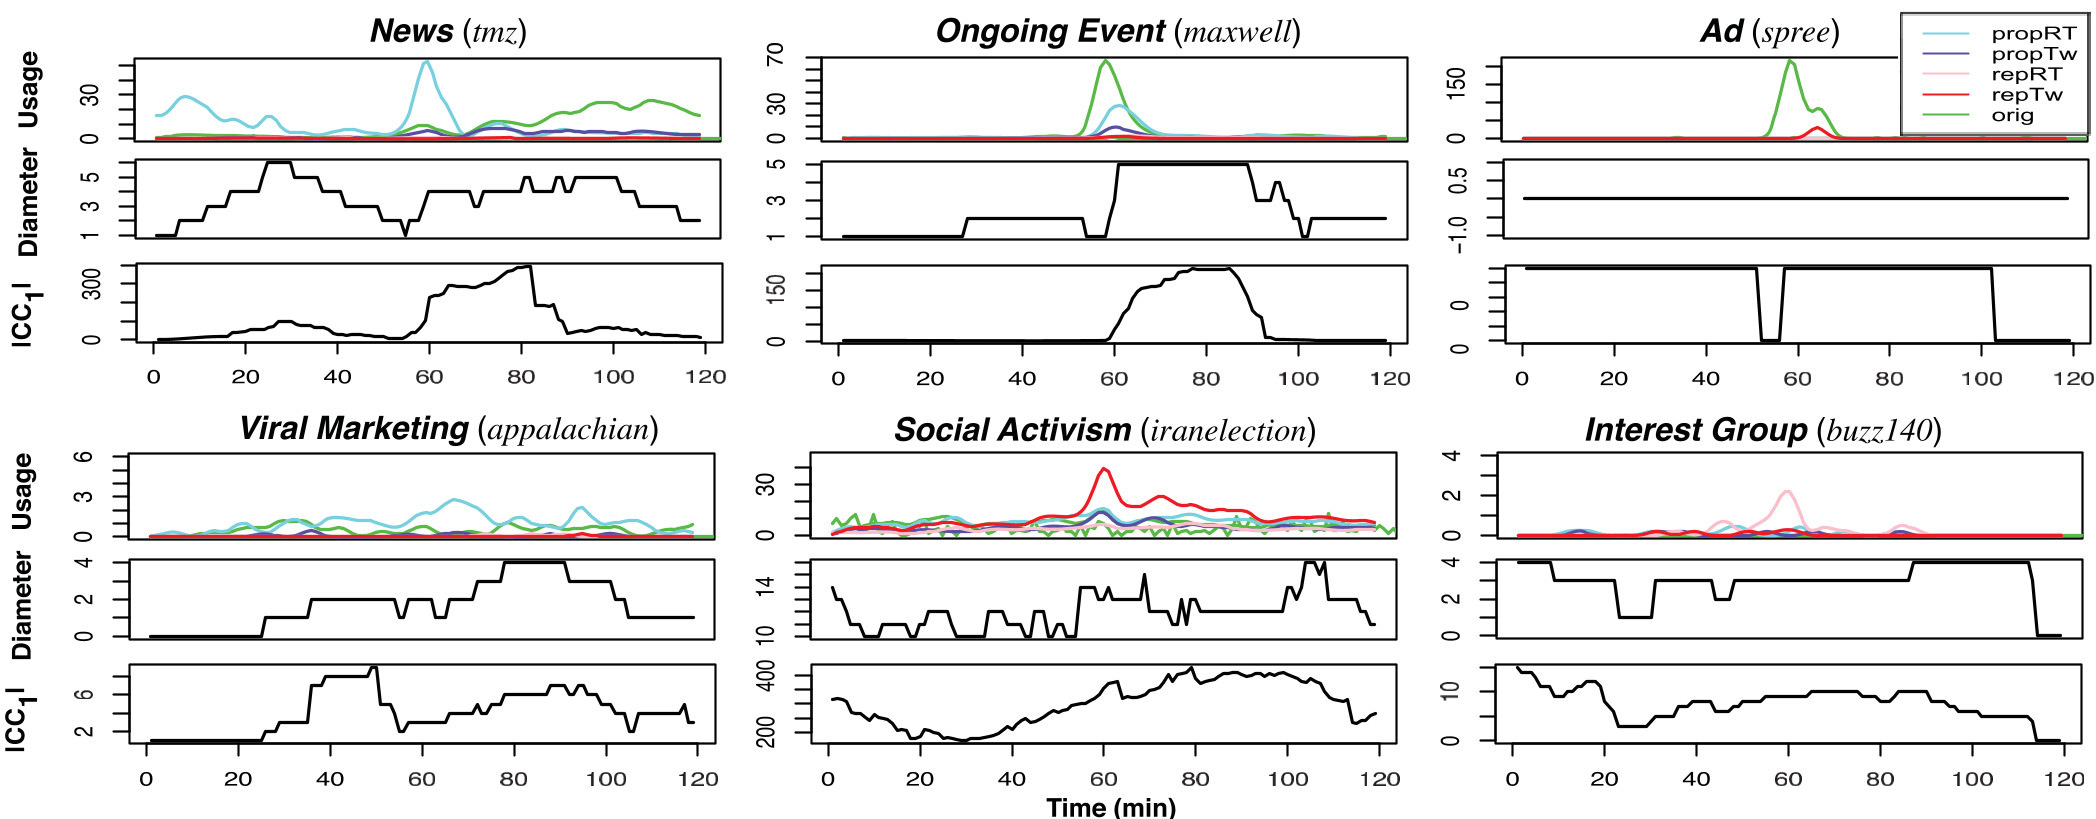
By applying hierarchical clustering with their new metric, the authors identified six "prototypes" of social interaction. These aren't just statistical clusters; they represent real-world social phenomena:
- The News Prototype: Quick propagation, followed by a minor peak of original content as experts weigh in.
- Social Activism: Characterized by committed users (high repetitive tweets) and a sustained, large connected component (strong community ties).
- Viral Marketing: High propagation (retweets) but often lacks a sustained community dialogue.
- The "Spam/Ad" Prototype: A sudden burst of original tweets but zero community engagement (diameter of 0).
Critical Insight: Why This Matters
The most striking finding is the role of Community Structure. The authors found that while user "roles" (whether they are retweeting or posting originally) help in fine-grained classification, the graph diameter and connected components are the best indicators for distinguishing broad categories of behavior.
If the diameter of a conversation doesn't grow, it’s not a viral movement—it’s either a broadcast (like an ad) or a closed-room discussion (like an interest group).
Conclusion & Future Work
Peng and Marculescu have provided a "social microscope" that looks beneath the surface of trending topics. While the study was conducted on a month-long Twitter dataset, its methodology remains highly relevant for modern problems:
- Bot Detection: Distinguishing between bot-driven "ad" patterns and human "news" patterns.
- Content Promotion: Identifying which content has the "viral DNA" early in its lifecycle.
- Crisis Management: Seeing the transition from a "breaking news" pattern to a "social movement" pattern in real-time.
The primary limitation is the current computational cost of hierarchical clustering for millions of events, marking incremental/scalable clustering as the next logical frontier for this research.
Note: This blog post is based on the paper "Identifying Dynamics and Collective Behaviors in Microblogging Traces" (2013).