
Beyond Circles: The ULS Scan Statistic and the Future of Geoinformatic Surveillance
7466_Upper level set scan statistic system for detecting arbitrarily shaped hotspots for digital governance.
The paper introduces the Upper Level Set (ULS) scan statistic system, a geoinformatic surveillance framework designed for spatial and spatiotemporal hotspot detection. By moving beyond traditional circular scanning windows, the method enables the identification of arbitrarily shaped hotspots across geographic regions and irregular networks.
TL;DR
Geoinformatic surveillance is critical for early warning systems in public health and national security. This paper introduces the Upper Level Set (ULS) Scan Statistic, a method that breaks the limitations of traditional circular scanning windows to detect arbitrarily shaped hotspots. By combining topological analysis with Partially Ordered Set (Poset) prioritization, the authors provide a framework for digital governance that is both spatially flexible and mathematically rigorous.
The "Circle" Problem: Why Traditional Hotspot Detection Fails
For years, solvers like SaTScan have been the gold standard for detecting clusters in spatial data. These tools typically work by moving a "window" (usually a circle or ellipse) across a map and calculating the likelihood of an outbreak within that window.
However, nature and human society rarely operate in perfect circles. A disease spreading along a river, a toxic plume driven by wind, or a crime wave following a specific subway line all form irregular shapes. Forcing these anomalies into a circular mold results in:
- Low Precision: Including too many "normal" areas in the result.
- False Sense of Security: Missing long, thin clusters that don't fill a circular window significantly enough to trigger an alarm.
Methodology: The Power of Upper Level Sets
The ULS approach treats the spatial data as a surface. Instead of imposing a shape, it looks at "level sets"—regions where the value of a specific indicator (e.g., infection rate) exceeds a certain threshold.
1. The ULS System
The system identifies hotspots by finding connected components of the data that remain above a specific value. This allows the "window" to grow and shrink organically according to the actual data distribution, effectively capturing the "true" morphology of the atmospheric or social phenomenon.
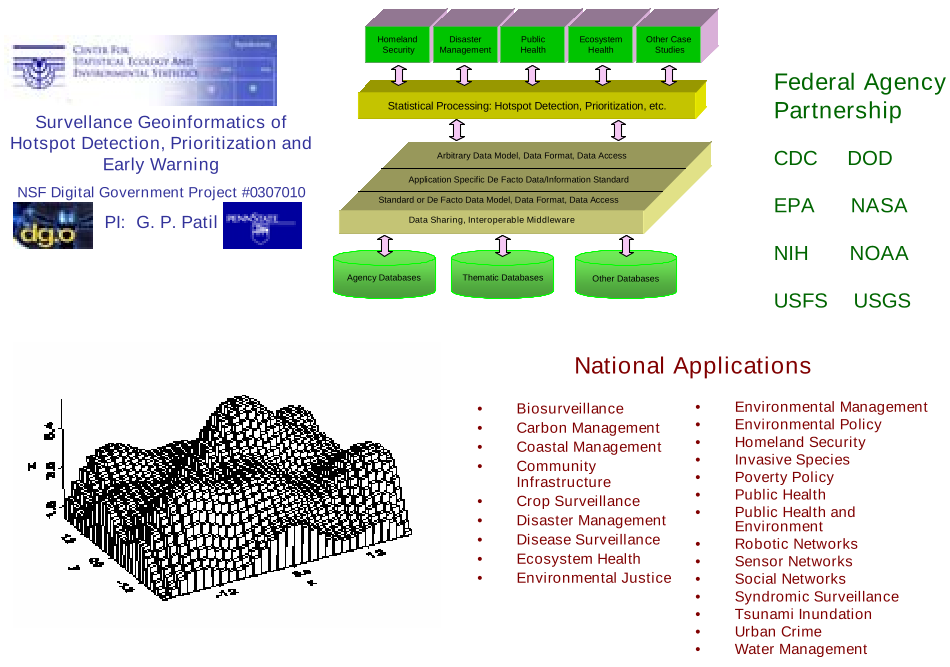 Figure 1: The NSF Digital Government project framework, bridging federal agencies and national surveillance applications.
2. Multi-Indicator Prioritization (Posets)
Detecting a hotspot is only the first step. Decision-makers often deal with multiple, sometimes conflicting, indicators (e.g., severity vs. population density). The authors propose using Partially Ordered Sets (Posets) and Hasse diagrams. This allows for a ranking system that respects the complexity of the data without oversimplifying it into a single, potentially misleading index score.
Innovation in Sensor Networks
The paper extends these concepts to Smart Sensor Networks. By employing a Probabilistic Finite State Automaton (PFSA), the system can model "normal" vs. "crisis" states in high-dimensional data streams. The ULS scan statistic is then applied to the resulting "crisis indices," allowing for the tracking of moving objects or shifting environmental threats in real-time.
Experimental Potential and Case Studies
The ULS system was tested across various domains, including:
- Public Health: Detecting irregularly shaped disease outbreaks.
- Eco-surveillance: Monitoring water resources and stream networks.
- Social Governance: Identifying persistent poverty trajectories.
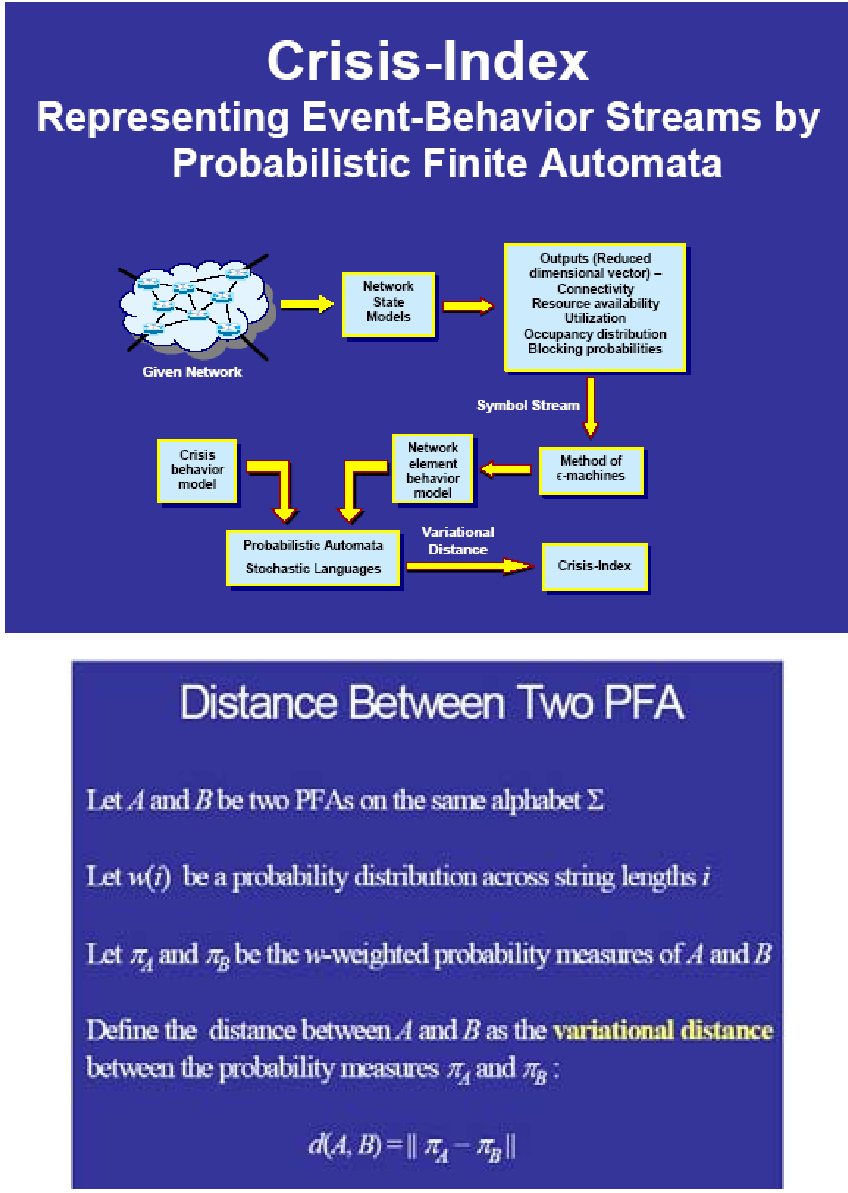 Figure 2: Visualization of various shaped hotspots and their prioritization trajectories.
Critical Insight & Conclusion
The genius of the ULS Scan Statistic lies in its topological agnosticism. By not assuming what a hotspot should look like, it uncovers what a hotspot actually is.
Takeaway for the Industry: In an age of high-velocity georeferenced data, we must move away from rigid geometric models. The ULS framework provides the necessary flexibility for digital governance while the Poset system ensures that prioritization remains transparent and multi-dimensional.
Limitations: While powerful, the ULS method is computationally more demanding than circular scans. As we scale to global-level sensor networks, the challenge will be maintaining the real-time efficiency of these topological calculations.