
Beyond the H-Index: Redefining Academic Value through Social Network Metrics
The academic social network
The paper introduces "pubstat.org," a platform that models the academic community as a social network rather than a simple database. It proposes three novel PageRank-based ranking metrics—Influence, Connections, and Exposure—to evaluate authors, institutions, and venues beyond traditional h-index and citation counts.
TL;DR
The academic world has long relied on Citation Counts and the h-index as the gold standards for success. However, these metrics are often "lagging indicators" that overlook the structural prestige of an author's network. This paper introduces a new suite of metrics—Influence, Connections, and Exposure—leveraging PageRank-like algorithms to map the "Academic Social Network." By analyzing millions of records from Microsoft Academic Search (MAS), the authors demonstrate that who cites you and where you publish can be more telling than how many times you are cited.
The "Slow Indicator" Problem
Why do we need new metrics? Prior work in bibliometrics treats citations as uniform "votes." This creates several issues:
- Citation Inflation: The sheer volume of papers today dilutes the value of a single citation.
- Delayed Gratification: It takes years for a groundbreaking paper to accumulate citations, making it hard to identify rising stars.
- Quantity vs. Quality: A researcher who workhorses on many mid-tier papers might have a higher h-index than a visionary who publishes one field-defining protocol.
The authors argue that academia is a Social Network. Like Facebook or LinkedIn, the "connections" (co-authors) and "shares" (citations) arrive with different weights depending on the nodes involved.
Methodology: The Super-Graph Approach
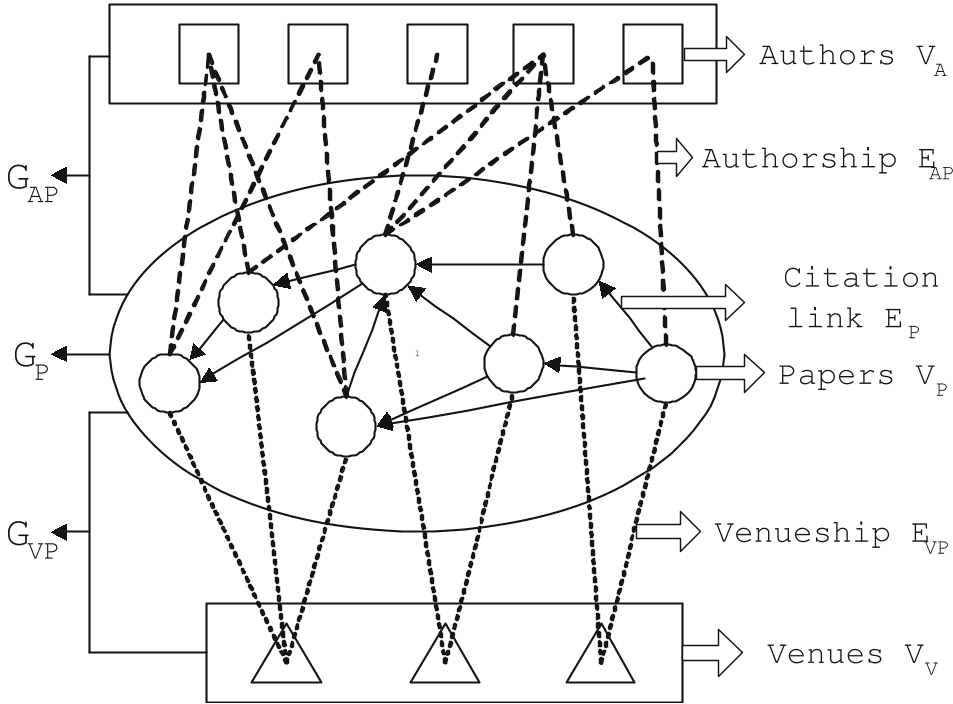
The core of this research is the construction of a heterogeneous network. Instead of just a paper-to-paper citation graph, the authors link three distinct entities:
- Papers ()
- Authors ()
- Venues () - i.e., Conferences and Journals
Defining the New Metrics
- Influence: It's not just about how many citations you have, but the Influence of the people citing you. If a Turing Award winner cites your work, your Influence score increases significantly more than if a student cites you.
- Connections: This measures your "social reach." High-connection authors collaborate with other highly-connected researchers, bridging different sub-communities.
- Exposure: This unique metric co-ranks authors and venues. It identifies researchers who are "exposed" to high-impact environments, often serving as a leading indicator for future Influence.
Validation: The Turing Test
To prove these metrics work, the authors applied them to Turing Award winners. While raw Citation Counts (CC) sometimes ranked these legends as "C" or "D" (due to older papers or field-specific citation densities), the Influence and Followers metrics consistently placed them in the "A" or "B" categories.
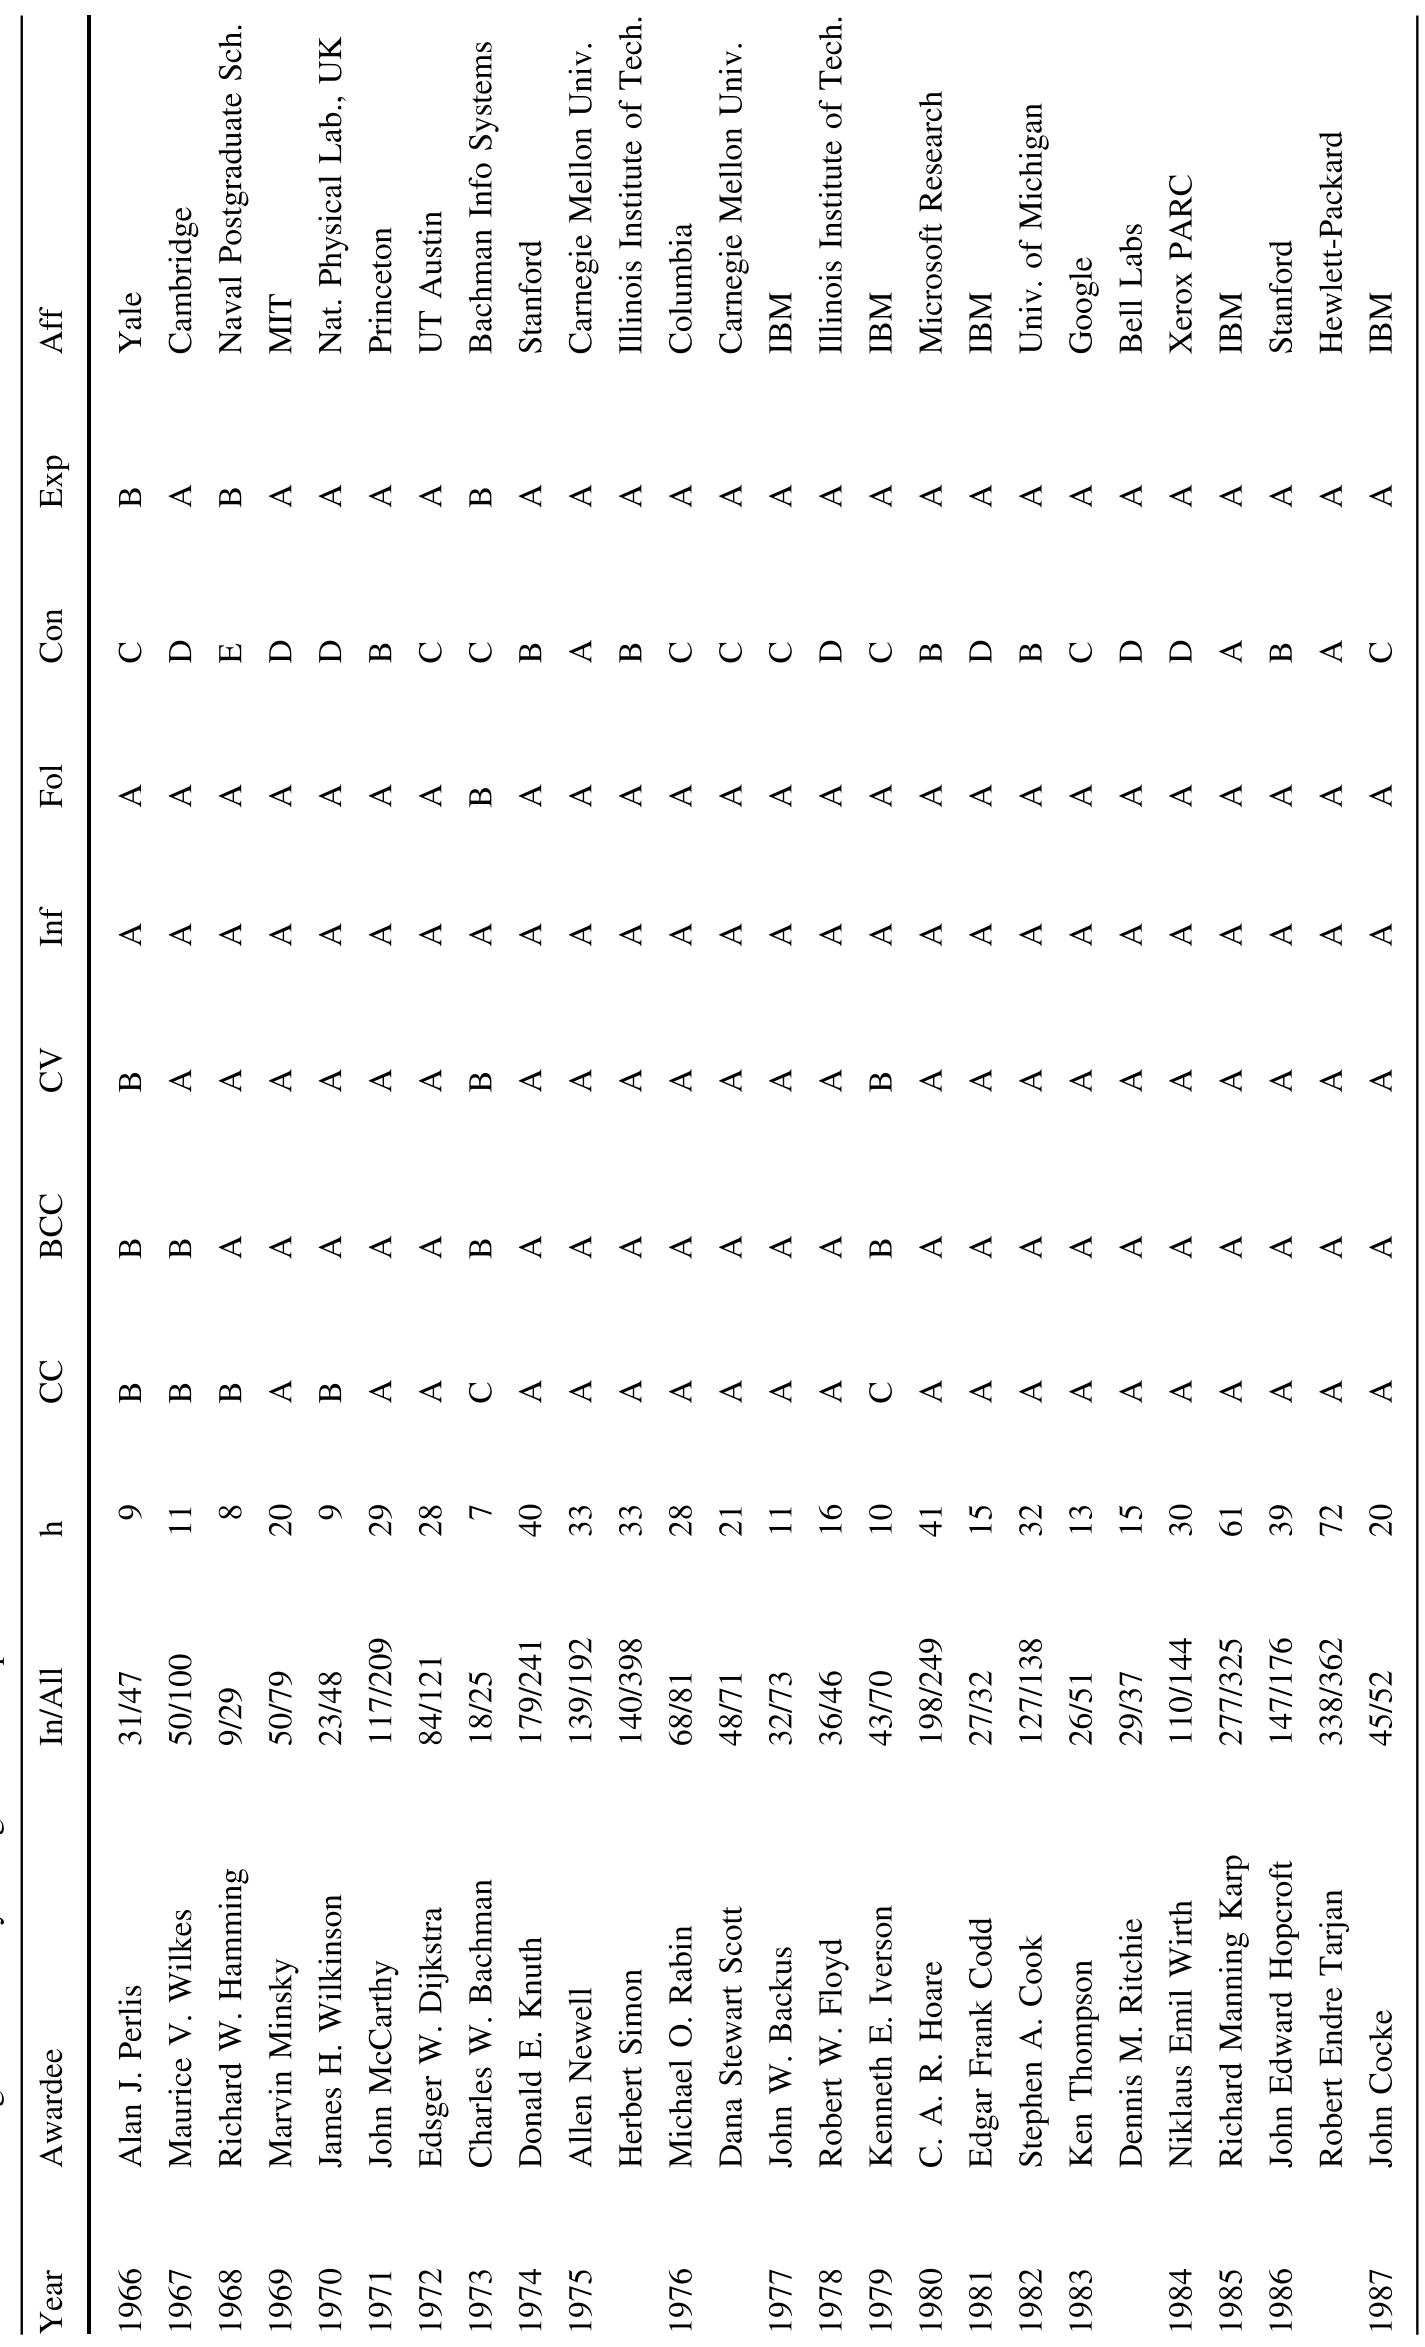
Table: Turing Award winners often show 'A' grades in Influence even when their raw Citation Counts (CC) are lower, proving the metric captures "prestige" over "volume."
Domain and Institution Insights
The study doesn't stop at individuals. By aggregating author scores, the authors created Institution Rankings. They found that while "Total Scores" favor large universities (like MIT or CMU), looking at the "Number of A-grade authors" allows smaller, elite institutions like Princeton to shine in specific domains.
Key Experimental Visualizations
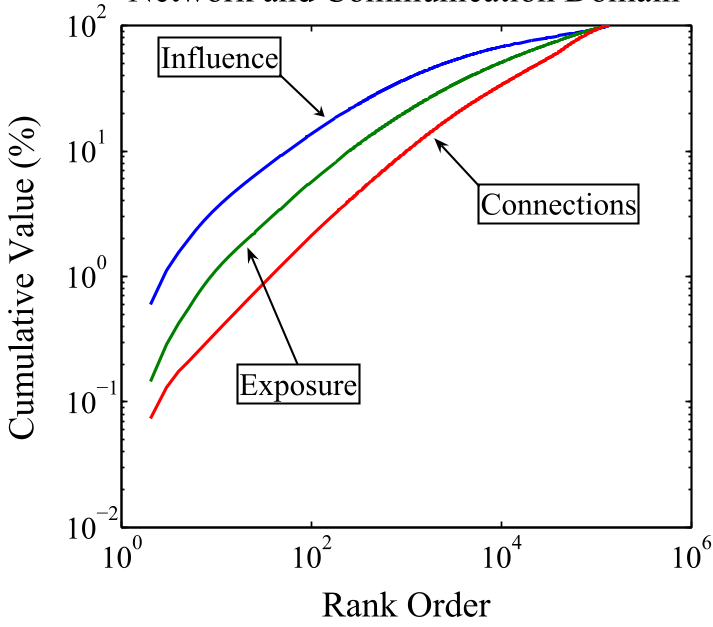
The researchers used log-log plots to show that the distribution of Influence, Connections, and Exposure follows a Pareto-like (Power Law) distribution, characteristic of true social networks.
Critical Analysis & Conclusion
Takeaway
The academic "Social Network" approach provides a much-needed "memory" for the field. Unlike CC, which favors currently "active" authors due to paper inflation, the Influence metric maintains the standing of past pioneers whose work continues to propagate through the network.
Limitations
- Name Disambiguation: The "John Smith" problem remains. Without a universal ID (like ORCID), data from MAS requires heavy cleaning to avoid merging different people.
- Database Completeness: The metrics are only as good as the underlying data (currently MAS CS domain).
Future Outlook
The authors envision these metrics being used by hiring committees, journal editors seeking reviewers, and students looking for influential mentors. By shifting the focus from "how much" to "how significant," we move closer to a fair evaluation of scientific contribution.