
Deconstructing Race Bias: Why Global Accuracy Fails to Tell the Whole Story
Accuracy Comparison Across Face Recognition Algorithms: Where Are We on Measuring Race Bias?
The paper investigates race bias in face recognition across generations of algorithms, specifically comparing pre-DCNN models with modern DCNNs (A2015, A2017b, A2019). It introduces a multidimensional framework analyzing data-driven factors and scenario modeling to pinpoint how bias manifests in Caucasian and East Asian face identification.
TL;DR
Even the most advanced Deep Convolutional Neural Networks (DCNNs) are not immune to race bias. This study reveals that while modern algorithms achieve near-perfect AUC scores, significant disparities emerge when looking at specific operational thresholds and challenging image conditions. The core finding? Race bias increases as the difficulty of the image pair increases.
The "Performance Blind Spot"
In the academic race for SOTA (State-of-the-Art), we often rely on Area Under the Curve (AUC) as a definitive metric. However, this paper argues that AUC is a "threshold-independent" measure that obscures what happens in the "tails" of the distribution. In high-stakes environments—like airport security—we care about specific, extremely low False Accept Rates (FAR).
The authors highlight a critical oversight in prior work: Demographic Heterogeneity. If your "different-identity" test set compares a young Asian woman to an old Caucasian man, the algorithm will find it "easy" to tell them apart, artificially inflating its performance. To fix this, the authors advocate for "Yoking"—matching the race and gender of non-identical pairs to force the algorithm to rely on actual identity features rather than demographic shortcuts.
Methodology: The GBU stress test
The researchers utilized the Good, Bad, and Ugly (GBU) dataset to categorize image pairs by difficulty. They compared four distinct generations of technology:
- A2011: A pre-DCNN fused algorithm.
- A2015: A classic VGG-based DCNN.
- A2017b & A2019: Modern ResNet and Inception-based architectures.
The Architecture of Evaluation
The study analyzed how the underlying distributions of "Same-identity" and "Different-identity" scores shift across races.
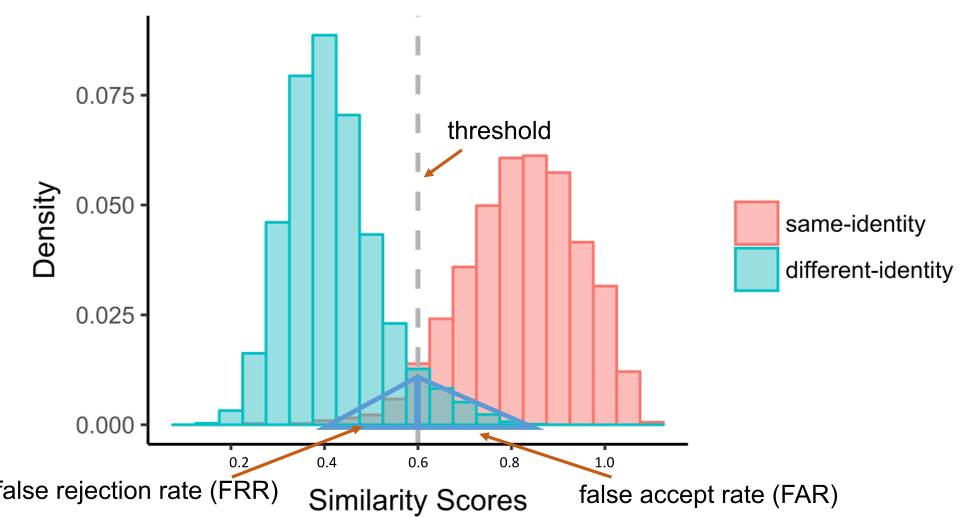 Figure 1: The standard Signal Detection Theory model where the overlap between distributions defines the error rate. Bias occurs when these distributions shift for specific subgroups.
Key Insights: The Difficulty Multiplier
The most striking discovery of this work is the relationship between Item Difficulty and Race Bias.
For "Good" images (high-quality, frontal), all DCNNs performed nearly perfectly for both Caucasian and East Asian faces. However, as the images became "Ugly" (poor lighting, difficult angles), the performance gap widened significantly.
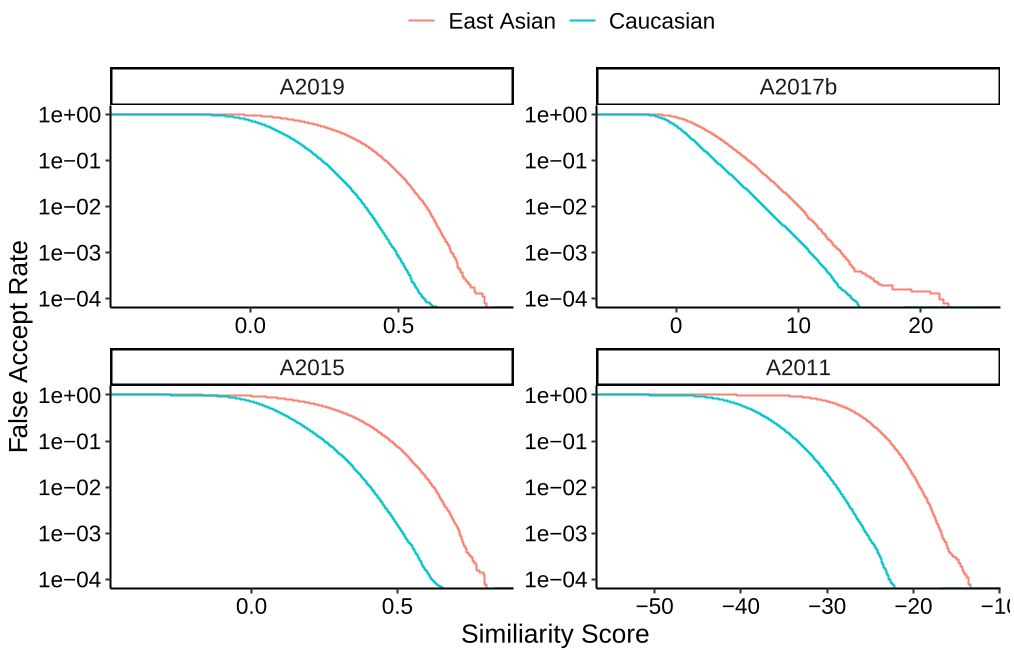 Figure 2: Threshold functions for A2019, A2017b, A2015, and A2011. Note the consistent rightward shift for East Asian faces (orange), indicating they require a higher similarity score to be considered a "match" at the same FAR.
The Threshold Dilemma
The study proves that a single uniform threshold is inherently biased. Because the similarity scores for East Asian different-identity pairs tended to be higher (the "East Asian threshold shift"), using the same cutoff for everyone results in a higher False Accept Rate for East Asian subjects.
Critical Analysis & Conclusion
While DCNNs are objectively "better" and "more accurate" than their predecessors, they have not eliminated the ORE (Other-Race Effect). The bias has simply moved to the more difficult edges of the data manifold.
Takeaways for AI Practitioners:
- Stop relying solely on AUC: Check your Verification Rate at specific FARs (e.g., 1 in 10,000).
- Yoke your test data: Don't let your "imposter" distributions be demographically diverse; match them to isolate identity recognition performance.
- Context is King: Bias metrics must be reported alongside image difficulty metrics. An algorithm might be "unbiased" on high-res mugshots but "highly biased" in wild, unconstrained surveillance footage.
The path forward requires a transition from global algorithmic evaluations to scenario-specific audits where thresholds are tuned to ensure equitable security outcomes for all demographic groups.