
Actions Are Louder than Words: The Quadratic Power of Social Media
Actions Are Louder than Words in Social Media
This paper explores the quantitative relationship between social media "chatter" (e.g., Twitter posts) and real-world physical actions (e.g., disaster relief donations). Using Hurricane Sandy as a case study, the authors demonstrate that actions scale superlinearly with chatter, specifically following a near-quadratic power law (action ∝ chatter^γ, where γ ≈ 2).
TL;DR
Does a 10% increase in social media chatter about a cause translate to a 10% increase in real-world activity? According to this research, the answer is a resounding no. Using data from Hurricane Sandy, researchers proved that real-world actions (like donations) scale quadratically with social media mentions. This means social media doesn't just reflect reality—it amplifies it through a "contagion" effect that reaches a vast, silent majority of users.
Problem & Motivation: The "Quiet User" Paradox
Predicting human response during disasters is notoriously difficult. Relief agencies typically look at demographics: "State X is wealthy and close to the storm, so they will donate more." However, this ignores the social network effect.
The authors identify a critical gap: the "quiet user" problem. On platforms like Twitter, for every person who tweets about donating, there are many others who see that tweet, get influenced, and donate—but never post about it. Most prior work assumed a linear relationship (Action ∝ Chatter), but if one tweet influences multiple "quiet" donors, the relationship must be superlinear. The challenge was proving how much louder actions are compared to words.
Methodology: Why γ ≈ 2?
The authors propose a theoretical framework based on three influence models: Contact, Excitation, and Proportionate.
The Intuition
If we assume:
- Broadcasters have influence sets proportional to the total number of broadcasters.
- These influence sets are largely disjoint.
- A fraction of those influenced will eventually act.
The math leads to a striking conclusion: in both random networks (Erdős-Rényi) and networks with power-law degree distributions (typical of Twitter), the scaling exponent naturally gravitates toward 2.
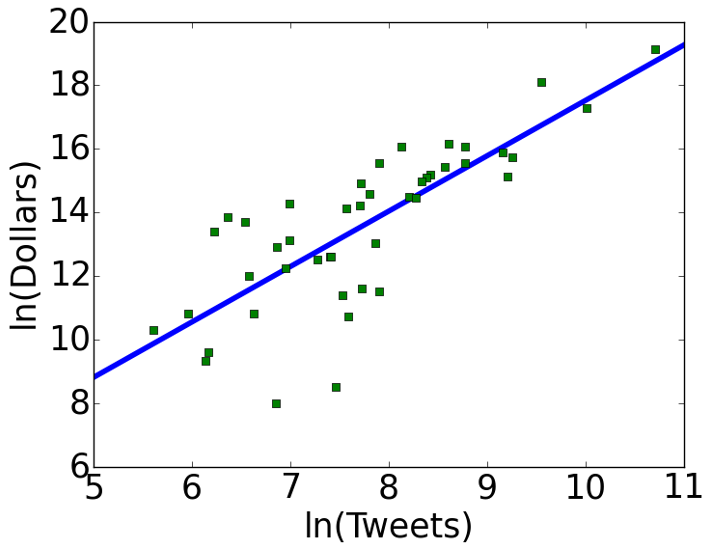 Fig 1: Theoretical mapping showing that as the social network parameters vary, the scaling exponent γ remains near the quadratic (2.0) mark.
Experiments: Hurricane Sandy Case Study
To validate this "Quadratic Amplification" theory, the team analyzed:
- 15 Million Tweets: Filtered using SVM classifiers to isolate donation-relevant chatter.
- Geolocation: Mapping tweets to specific US States.
- Real Donation Data: Sourced from the Foundation Center’s report on the $402M response to Sandy.
Results: Demographics vs. Twitter
The researchers compared their social media model against a benchmark using population, income, and distance.
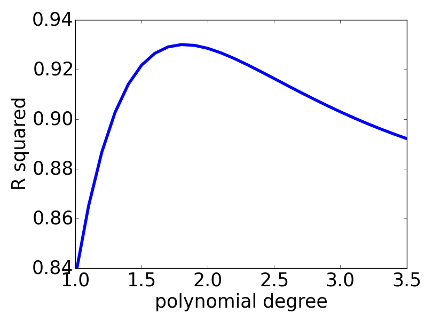 Fig 2: Statistical verification showing that an exponent γ ≈ 2 provides the highest R² (goodness of fit) and lowest error.
Key Findings:
- Superlinear Confirmation: The optimal fit for the data was an exponent of 1.74—clearly superlinear.
- Superior Accuracy: The Twitter-based quadratic model achieved an R² of 0.93, while the demographic model sat at a mediocre 0.53.
- The Multiplier Effect: Twitter captures social influence that demographic data simply cannot see.
Critical Analysis & Conclusion
Takeaway
The core contribution of this paper is the shift from "counting heads" to "measuring influence density." The finding that Action ∝ Chatter² suggests that social media strategies for NGOs and relief groups shouldn't just aim for "reach," but for the density of broadcasts within specific network clusters to trigger the quadratic amplification.
Limitations
- Static Snapshot: The study uses an aggregate snapshot. In reality, the "contagion" happens over time, and the temporal dynamics might change the exponent.
- Data Sparsity: Only ~1% of tweets are available via the public API, and geocoding is imperfect, though the authors argue this error is proportional across states.
Future Outlook
This methodology isn't limited to donations. It provides a blueprint for forecasting evacuation compliance, political movements, or the spread of public health behaviors. In a world where most users are "passive" observers, this research provides the key to deciphering the silent actions behind the digital noise.