
Unleashing Social Influence: How Activity Awareness Transforms Family Health Platforms
Activity awareness in family-based healthy living online social networks
The paper presents a novel activity awareness user interface for a family-based healthy living social network. It introduces visual elements like scorecards and performance graphs to track online social behaviors and real-world physical activities, achieving significantly higher user engagement and health education compared to traditional platforms.
TL;DR
CSIRO researchers have developed a novel user interface for "Activity Awareness" within family-centric social networks. By integrating mathematical scoring systems with visual feedback tools like scorecards and performance graphs, the system bridged the gap between online interaction and real-world health improvements, leading to significantly higher engagement and better management of lifestyle habits like diet and exercise.
Problem: The Missing Link in Digital Health
While the correlation between social support and health is well-documented, most digital platforms struggle to keep users motivated. Most "activity awareness" research was historically confined to office settings (coordinating work) or simple family "check-ins" (connectedness). The challenge addressed here is: How do we make the activities of others serve as a context for one's own health improvement?
Methodology: Quantifying Lifestyle Awareness
The researchers moved beyond simple status updates by creating a weighted performance model for two domains:
1. Online Social Activities
Every interaction (viewing forums, writing blogs) is assigned a weight () based on its contribution to community sustainability. The total individual performance () is calculated as:
2. Real-World Healthy Living
Users log activities in a diary, categorized by four intensity levels (Mild to Hard). The physical performance () accounts for both intensity () and duration ():
Visualizing Motivation
The interface translates these formulas into intuitive Scorecards and Performance Graphs, allowing users to see where they stand relative to the community average and the "top performers," effectively utilizing social proof to drive behavior.
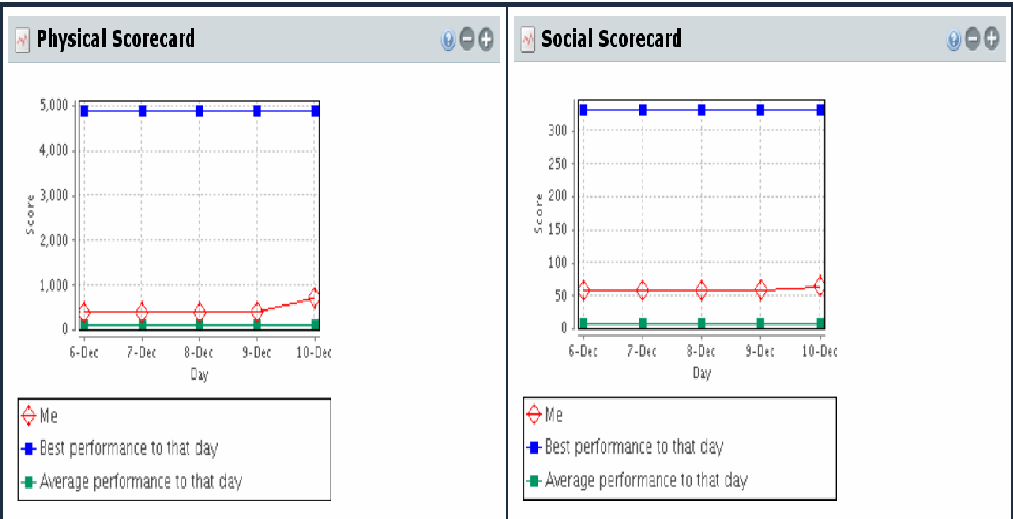 Figure 1: UI elements showing individual scorecards and community performance comparisons.
Experiments & Results: Awareness Leads to Action
The team conducted a study with 92 families (368 participants), split into a control group (A) and an experimental group with the awareness interface (B).
- Higher Content Engagement: Group B interacted with recipes and shopping lists significantly more than Group A ().
- Enhanced Learning: Group B reported a significantly higher understanding of healthy living principles (M=1.9 vs. M=1.69).
- Quantifiable Lifestyle Change: Most notably, the awareness interface had a statistically significant impact on reducing smoking and alcohol consumption ().
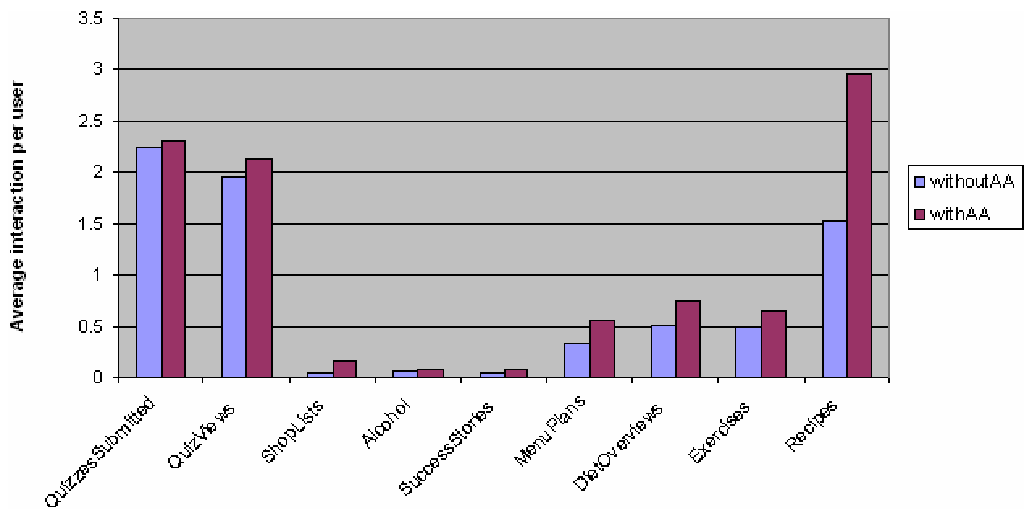 Figure 2: Significant increase in recipe and shopping list interaction for the awareness-enabled group.
Critical Analysis & Conclusion
Takeaway
The success of this interface lies in its ability to provide context. By knowing what others are doing, users can "narrow the gap" between their current state and the community norm. This work proves that UI design is not just about aesthetics but about building "social mirrors" that encourage positive behavior.
Limitations & Future Work
The study relied on self-reported data for real-world activities (the activity diary). Future iterations aim to integrate wearable activity monitors to automate data capture, removing the "memory bias" and manual effort of logging. Additionally, further research is needed to determine if these effects persist beyond the 3-week study window.
Final Summary
This CSIRO study demonstrates that when we visualize our health journey relative to our family and community, we aren't just looking at data—we are participating in a shared social experience that drives us to live healthier lives.