
The Contagion of Doubt: Modeling Trusting Behavior Diffusion in Social Networks
An Activity-Based User Trusting Behavior Diffusion Model in Social Networks
The paper introduces an activity-based user trusting behavior diffusion model that categorizes social network users into three psychological modes: Optimistic (A), Moderate (B), and Pessimistic (C). It evaluates trust using both positive and negative interaction signs (e.g., retweets, mentions, replies) and demonstrates how these behavioral modes propagate and shift across neighbors in a network.
TL;DR
This research moves beyond treating trust as a simple numerical value. It proposes that "how we trust" (our behavioral mode) is a contagious state. By categorizing users as Optimistic, Moderate, or Pessimistic, the authors demonstrate through Twitter data that these modes diffuse through interactions, with pessimistic behavior often exerting a stronger influence on the community than optimism.
Background: Beyond Static Trust Scores
In most social network analyses, trust is viewed as a static edge weight. However, humans are fickle. An "optimistic" user might ignore a few missed replies, while a "pessimistic" user sees a single ignored mention as a total breach of trust. The core motivation of this paper is to acknowledge that users have different Inductive Biases regarding social signals and that these biases can be influenced by the people around them.
Methodology: The Three Modes of Trust
The authors define three distinct mathematical regimes for calculating trust based on user activities (Retweets, Mentions, Replies):
- Optimistic Mode (A): High weight on positive interactions, low sensitivity to negative ones.
- Moderate Mode (B): Balanced weighing of all interactions; negative signs are more damaging than in Mode A.
- Pessimistic Mode (C): Uses a Time-Decay Factor (). Recent interactions are heavily weighted, and trust is hard to earn but easy to lose.
The Diffusion Mechanism
The model treats trust behavior like a contagion. If a user is trusted by many "Pessimists," they are likely to adopt a pessimistic trusting mode themselves in the next time step. This is calculated using a Normalized Average Impact formula.
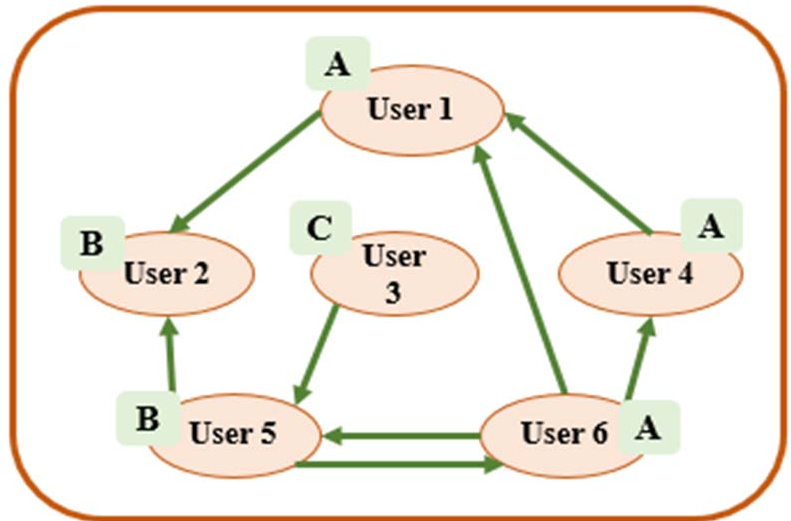 Figure 1: Visualization of the social network where nodes carry specific behavioral modes (A, B, or C).
Experiments and Insights
Using the Twitter Higgs Boson dataset, the authors mapped positive signs (Common neighbors, replies) against negative signs (unanswered mentions).
Key Findings:
- Pessimism is Stickier: The experiments show that Mode C (Pessimistic) often dominates the network over time. Transitions toward a pessimistic state are "easier" because users naturally prioritize negative signals for risk mitigation.
- Out-degree Matters: Nodes with high out-degree act as "super-spreaders" of trusting behavior. If a central hub becomes pessimistic, the surrounding cluster quickly follows suit.
- Fluctuation: Unlike traditional models where trust only increases or decreases, this model shows users "switching" modes dynamically (Mode A Mode B), mirroring real-world human volatility.
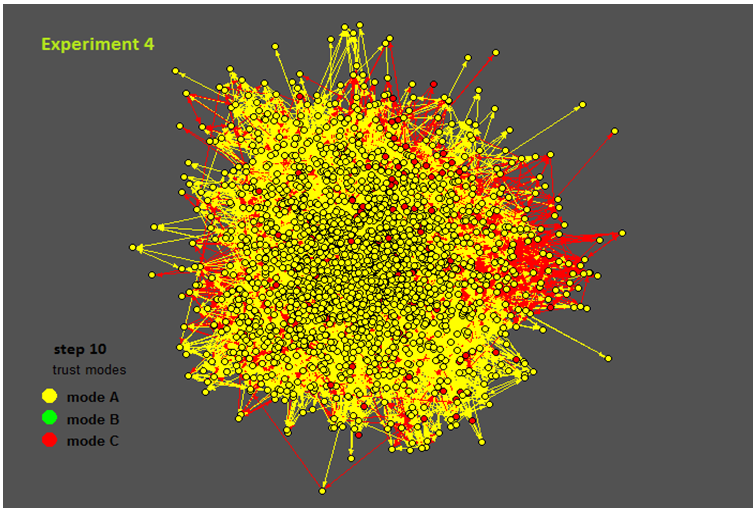 Figure 2: The 10th step of diffusion showing the dominance of different modes (Red = Mode C/Pessimistic).
Critical Analysis & Conclusion
Takeaway
The paper successfully bridges the gap between Social Network Analysis (SNA) and Behavioral Psychology. It proves that the "Trusting Climate" of a network is highly dependent on the initial state of influential nodes.
Limitations
- Scalability: The experiment utilized a subset of 2,000 nodes; the computational complexity of recalculating modes for millions of users in real-time remains a challenge.
- Binary Signs: The model assumes "no reply" is a negative sign, which might simply be due to user inactivity rather than a breach of trust.
Future Outlook
The next frontier for this work is "Trust Dampening"—identifying specific nodes to "immunize" with optimistic behavior to stop a cascade of community-wide pessimism or distrust during a crisis.