
Adaptive Survey Design: Bridging the Gap Between Sample Data and Social Network Reality
Adaptive Survey Design Using Structural Characteristics of the Social Network
This paper introduces an Adaptive Survey Design framework that optimizes the representativeness of online social network samples by targeting specific structural characteristics. By utilizing the K-bins algorithm and Kullback-Leibler divergence, the method minimizes the distance between sample distributions and the original network's global properties (e.g., degree centrality, clustering coefficient).
TL;DR
In the world of social science and network analysis, surveys are often "broken" by self-selection bias—where only a certain type of user responds. This paper presents a structural solution: an adaptive sampling framework that uses real-time network measures (like Centrality and Clustering Coefficients) to guide the survey process. By iteratively targeting "long-tail" users, the researchers achieved a sample that statistically mirrors the entire network's architecture, even with small response sets.
Contextual Positioning
Most survey methodologies are static; you send out a thousand invites and analyze whoever replies. This paper moves the field toward dynamic intervention. It positions itself as a refinement of "Respondent-Driven Sampling," but instead of relying on participants to recruit others, it uses the network's own structural "fingerprint" to decide who to invite next.
The Core Challenge: The Shadow of Self-Selection
Current social media research often defaults to samples of students or voluntary participants. However, "active" respondents often have higher degrees (more friends) and different clustering behaviors than the average user.
- The Failure of Random Sampling: At low response rates (e.g., 5%), random sampling fails to capture the structural diversity of the network.
- The Attribute Trap: Matching a sample by age or gender doesn't mean you've matched the way information flows through them.
Methodology: The K-Bins & KL-Divergence Approach
The authors propose a closed-loop system called the Multistage Survey Control System.
1. Measures and Normalization
First, they calculate global distributions () for measures like In-Degree, Out-Degree, and Clustering Coefficients. They normalize these into a single metric () to handle different scales.
2. The Evaluation Function (EV)
Using Kullback-Leibler (KL) Divergence, the system measures the "distance" between the current respondent sample () and the total network profile (). The goal is simple: Keep sampling until falls below a desired threshold ().
3. The K-bins Algorithm (The Secret Sauce)
While simple sorting algorithms (Alg 1 & 2) over-represent typical users, Alg 3 (K-bins) creates a histogram of the network. It explicitly targets nodes from every "bin" of the network's structural distribution, ensuring the "long-tail" (users with rare connectivity patterns) is included.
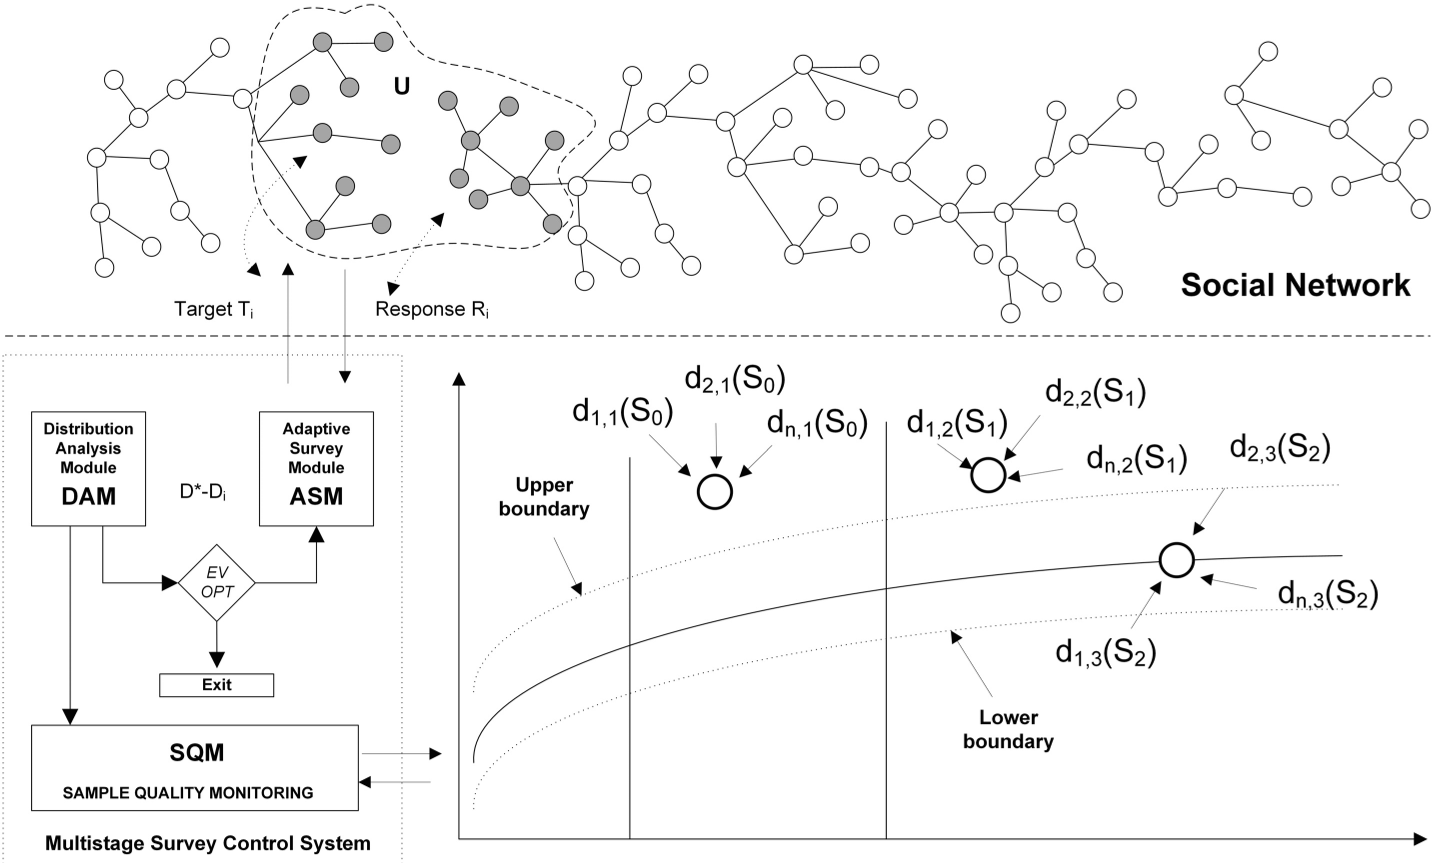 Figure 1: The Adaptive Survey Control System architecture, showing the feedback loop between sample analysis and target selection.
Experimental Validation
The researchers tested their method on a virtual social world for adolescents.
- Initial Bias: Surveyed users had an average in-degree of 99.26, while the actual network average was only 30.62. This confirms that "popular" users are much more likely to participate in surveys.
- Efficiency: The K-bins algorithm converged to the true distribution significantly faster than random sampling.
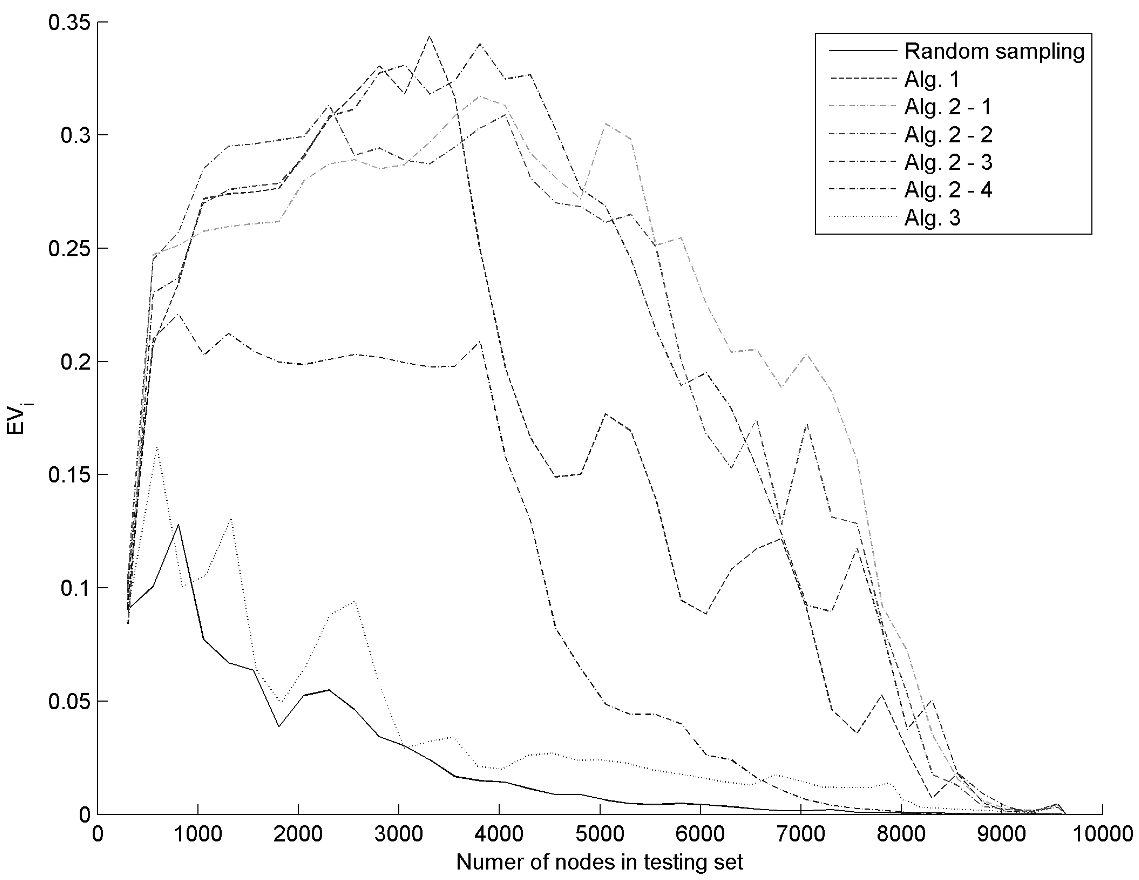 Figure 2: Performance of the K-bins algorithm (Alg 3) vs. Random Sampling. Note how Alg 3 reduces the error (EV) much more sharply as sample size increases.
Critical Insights
- Diminishing Returns: The study found that after reaching about 20% of the population, the benefit of further adaptive sampling drops. This provides a clear "stopping rule" for researchers to save costs.
- Anti-correlated Measures: One major takeaway is the difficulty of balancing divergent measures (like degree vs. clustering). If one increases while the other decreases, simple optimization fails. The K-bins method handles this by focusing on the distribution rather than just the mean.
Conclusion & Future Work
The paper successfully demonstrates that we can "force" a sample to be representative by treating network structure as a primary constraint. The main limitation is that the researcher must have access to the full network's structural data beforehand—making this most useful for platform owners (like LinkedIn or Facebook) or researchers with API access to full graphs.
Future work will likely look into non-equal sized bins and more complex distance metrics to handle highly polarized community structures.