
The R-I Model: Decoding Social Ad Pricing Through Two-Sided Market Theory
The Analysis of Advertising Pricing Based on the Two-Sided Markets Theory in Social Network
This paper introduces the Relation-Intensity Model (R-I model) for Social Network Advertising Pricing (SNAP), utilizing two-sided market theory. It addresses the optimal asking price for advertisers by incorporating social network topology (clustering coefficients) and user engagement metrics, identifying a critical user threshold for price optimization.
TL;DR
Social network advertising is not just about volume; it's about the "intensity" of the connections. This paper proposes the Relation-Intensity (R-I) Model, shifting focus from traditional CPM/CPC models to a bilateral market approach. The core discovery? A pricing "threshold" exists where, after a certain level of user density is reached, the platform should actually decrease ad prices to maximize profit through scale effects.
Context & Motivation: Why Social is Different
In traditional media, an audience is often a passive collection of individuals. In social networks, users are an interconnected web where a friend's recommendation is 12 times more impactful than a standard ad. However, most platforms still use legacy pricing models. The authors argue that because social users are generally "ad-averse," the platform must balance the negative utility of ads against the positive utility of social connections.
Methodology: The R-I Model
The authors build upon Armstrong’s Two-Sided Market Theory. A social network is a classic bilateral market:
- Users provide the "eyeballs" but suffer "disutility" from seeing ads.
- Advertisers pay for access to users, gaining utility from the number of users and the strength of their relationships.
The Secret Sauce: Relationship Intensity ()
The R-I model quantifies "Social Relationship Intensity" () using two variables:
- Clustering Coefficient (): How tightly knit a user's local network is.
- Online Time (): The service level and user preference for the platform.

The model derives the optimal price by balancing marginal costs, cross-network externalities (), and the squared effect of user growth ().
The "Threshold" Phenomenon
The most striking insight of the paper is the non-linear relationship between user count and price.
- Phase 1 (Growth): As the network grows, the value to advertisers increases, allowing the platform to raise prices.
- Phase 2 (Saturation/Scale): Once the user base hits a threshold, the "Price Elasticity of Demand" becomes very large. At this point, the scale effect (more ads at lower prices) yields higher profits than the price effect (fewer ads at high prices).
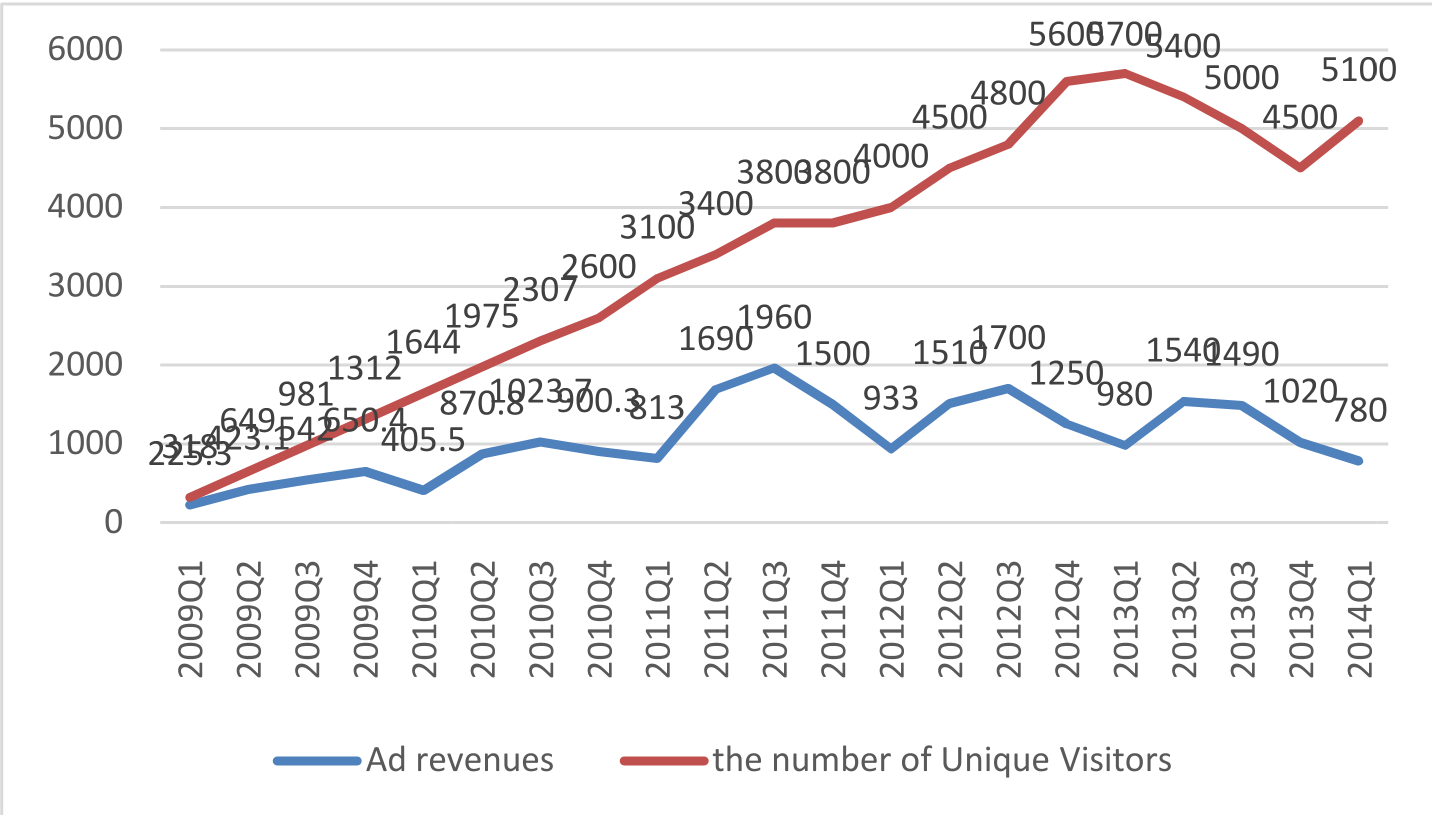 Figure: Empirical data from Renren (a Chinese social network) confirms that advertising revenue eventually exhibits a seasonal but declining growth rate relative to massive user surges, indicating a threshold effect.
Experimental Validation
The authors tested their model against data from Renren (2010-2014). Using a regression fitting without intercept, they found that when unique visitors reached a peak (around March 2012), the ad revenue behavior shifted, validating the inverted-U trajectory predicted by the R-I model.
Critical Insight & Conclusion
This research proves that platform value is not linear.
- Direct Impact: Higher relationship intensity () attracts more users.
- Indirect Impact: Once exceeds the threshold, the platform can achieve "Pareto Optimality"—lowering prices for advertisers while maintaining high profitability through the sheer volume of high-quality, interconnected users.
Limitations
The study focuses on a monopolistic platform. In the real world, "multi-homing" (users using both Facebook and TikTok simultaneously) would complicate the pricing dynamics, as platforms must compete not just for attention, but for the "exclusivity" of the social tie.
Final Takeaway: For modern Social Commerce, pricing is a function of topology, not just traffic.