
Beyond the Like Button: How Emotional Arcs and Interactional Affect Drive Video Engagement
9951_Understanding affective interaction Emotion, engagement, and internet videos.
This study investigates the complex relationship between emotion and user engagement in Internet videos using a four-tier mixed-method approach. By triangulating physiological data (heart rate), emotional self-reporting (Scherer’s descriptors), and qualitative prose reviews, the research identifies how "emotional arcs" and contextual factors drive video preferences and "viral" potential.
TL;DR
Why do we share some videos while others leave us "bored" or "disgusted"? This 2008 study from Indiana University moves beyond simple "click-tracking" to explore the physiological and psychological mechanics of viral videos. By combining heart rate monitoring with deep qualitative reviews, the researchers discovered that the structure of the emotional experience—the "arc"—and the personal context we bring to the screen are more important than the actual quality of the video's production.
The "Conduit" Problem: Why Affect is Not Just Data
In the early days of Affective Computing, the prevailing theory was the "Information Processing" model. It viewed emotion as a bit of data transmitted from a computer to a user—a simple stimulus-response.
The authors of this paper argue that this is too reductive. They align themselves with the "Interactional Model", suggesting that emotion isn't just "in" the video; it's co-created by the viewer's history, their expectations of genre (like "leet speak" in Flash animations), and their unique biological responses. The challenge was: how do you measure something so subjective and invisible?
Methodology: The Four-Tier Triangulation
To capture the "elusive" nature of emotion, the researchers used a sophisticated mixed-method setup:
- Physiological: Heart rate and breath rate via the Zephyr BioHarness™.
- Emotional Tagging: Users selected from 36 descriptors (like "amusement" or "tension") and rated intensity.
- Prose Reviews: Open-ended text where users explained why they felt what they felt.
- Behavioral: Tracks of how users navigated between genres (Action, Comedy, Mashup, etc.).
 Figure 1: The study instrument featuring the video player and navigation interface used to collect multi-modal data.
Key Insight 1: Arousal Equals Preference
The data confirmed a physiological link to preference. Using ANOVA tests, the researchers found that heart rate (HR Score) was significantly higher for 5-star videos than for 1-star videos. However, breath rate (R Score) showed no significant correlation, suggesting that while the heart feels the "excitement," breathing patterns are too noisy for reliable engagement metrics in this context.
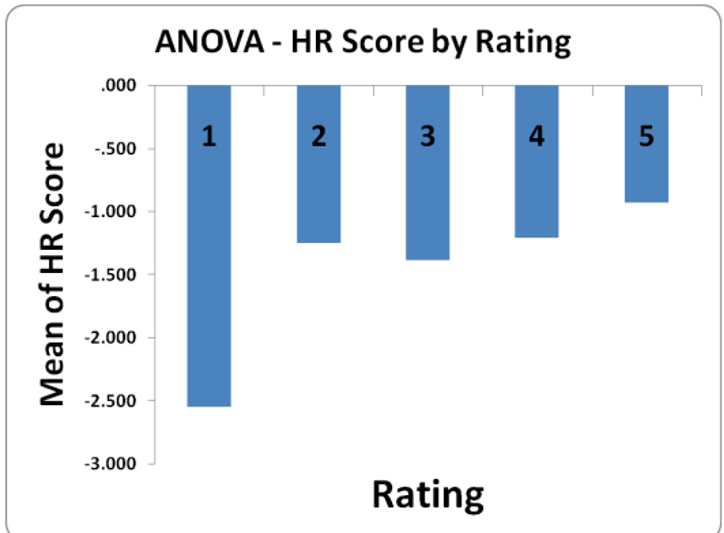 Figure 2: ANOVA showing the positive correlation between Heart Rate Score and Video Rating. Higher engagement triggers higher biological arousal.
Key Insight 2: The Power of the Emotional Arc
One of the most profound qualitative findings was that users don't need "happy" videos to be happy.
- Low-rated videos often left users "unresolved" or "confused"—the emotional tension never broke.
- High-rated videos often featured negative emotions (fear, anxiety, disgust) that were resolved into humor or hope by the end.
The study suggests that humans crave an emotional arc. We are willing to sit through tension if the "payoff" is satisfying, which explains the enduring popularity of genres like Horror or Drama even in short-form Internet video.
Key Insight 3: Context Trumps Content
The "Interactional" side of the study showed that external factors often overrode the video's content.
- Empathy: One user gave a 5-star rating to a video with "poor graphics" simply because a Beatles song reminded her of her fiancé.
- Genre Norms: Users who didn't understand "leet speak" or the "animutation" subculture rated videos as "1-star/disgusting," whereas community members found them hysterical. Engagement is a gate-kept experience based on cultural literacy.
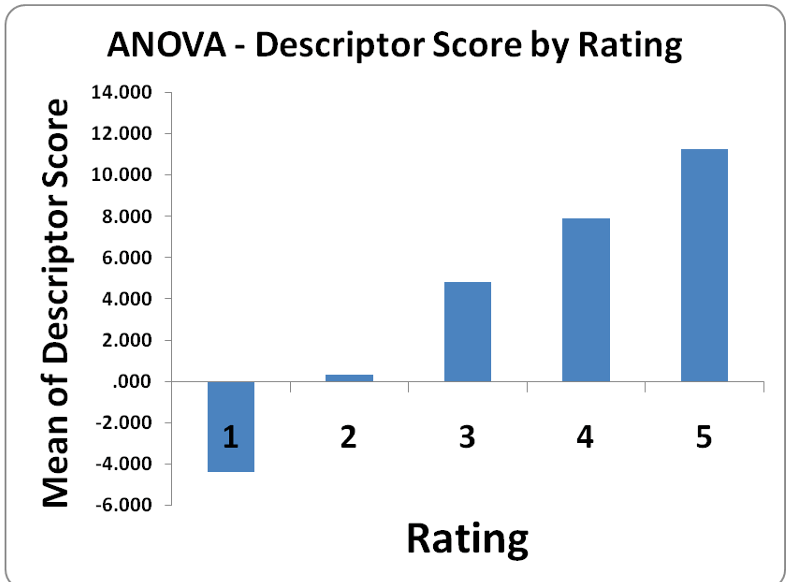 Figure 3: Emotional tagging scores (intensity x valence) vs. video ratings. Note the sharp linear increase, validating that perceived emotional intensity is the primary driver of user rating.
Critical Analysis & Conclusion
This paper is a cornerstone for UX researchers because it proves that biometric data alone is insufficient. Without the "Prose Reviews," a researcher might see a high heart rate and assume a user is "happy," when they might actually be "disgusted" but highly engaged.
Takeaway for Designers:
- Design for Resolution: If your content or interface creates tension, ensure there is a clear "arc" that leads to resolution.
- Acknowledge the Viewer's Baggage: User engagement is not a vacuum. The viewer's memories and cultural background are the "filters" through which your content is processed.
- Triangulate or Fail: To truly understand user experience, you must combine the "What" (behavior), the "How" (physiology), and the "Why" (qualitative self-report).
Future Work: As we move into the era of AI-generated content, how can algorithms be tuned to create these "emotional arcs" rather than just maximizing immediate, shallow click-through rates?