
CDR-Based Epidemic Modeling: Quantifying the Impact of Mobility Restrictions on H1N1 Spread
An Agent-Based Model of Epidemic Spread Using Human Mobility and Social Network Information
This paper presents an Agent-Based Model (ABM) that leverages large-scale Call Detail Records (CDRs) to simulate the spread of the H1N1 virus. By integrating real-life individual mobility patterns and social network data, the study accurately quantifies the impact of government-mandated mobility restrictions during the 2009 Mexican outbreak.
TL;DR
This research pioneers the use of Call Detail Records (CDRs) within an Agent-Based Model (ABM) to simulate the 2009 H1N1 outbreak in Mexico. Unlike traditional models that use static census data, this approach captures real-time behavioral changes. The study finds that government-mandated lockdowns reduced peak infections by 10% and delayed the peak by 40 hours, proving the efficacy of mobility restrictions through the lens of big data.
Background: Beyond Homogeneous Compartments
Traditional epidemiology has long relied on compartmental models (SIR/SEIR). While effective for general trends, they assume every individual in a "compartment" behaves identically. This ignores the reality of human dynamics—where we go and who we talk to changes everything. While ABMs were proposed to solve this, they originally lacked "real" data, relying instead on surveys that represent a single snapshot in time rather than a living, breathing society responding to a crisis.
Methodology: Insights from the Digital Footprint
The authors utilized a dataset of 1 billion CDRs to construct three distinct models for each of the 25,000 agents:
- Mobility Model: Predicts an agent's location (at the BTS/Cell Tower level) for every hour of the day, distinguishing between weekdays and weekends.
- Social Network Model: Identifies "close contacts" based on reciprocal communication. This is crucial because physical proximity (and thus infection risk) is higher among social acquaintances.
- Disease Model: A state-transition framework (Susceptible → Exposed → Infective → Removed) governed by probabilistic encounter rates.
Architecture and Social Probability
A key innovation is the distinction between two probabilities:
- p1 (0.9): Probability of physical closeness if two agents in the same area share a social link.
- p2 (0.1): Probability of physical closeness for strangers in the same area.
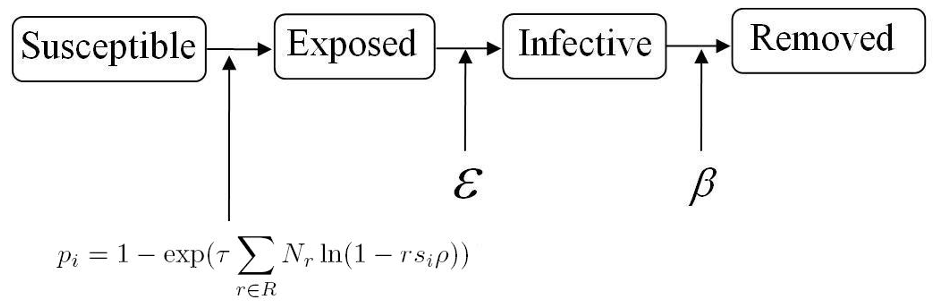 In the figure above, the disease progression logic integrates with a spatial encounter model to determine transmission.
Experiments: The Mexican H1N1 Case Study
The researchers compared a Baseline Scenario (normal mobility) against an Intervention Scenario (actual behavior during the 2009 mandates).
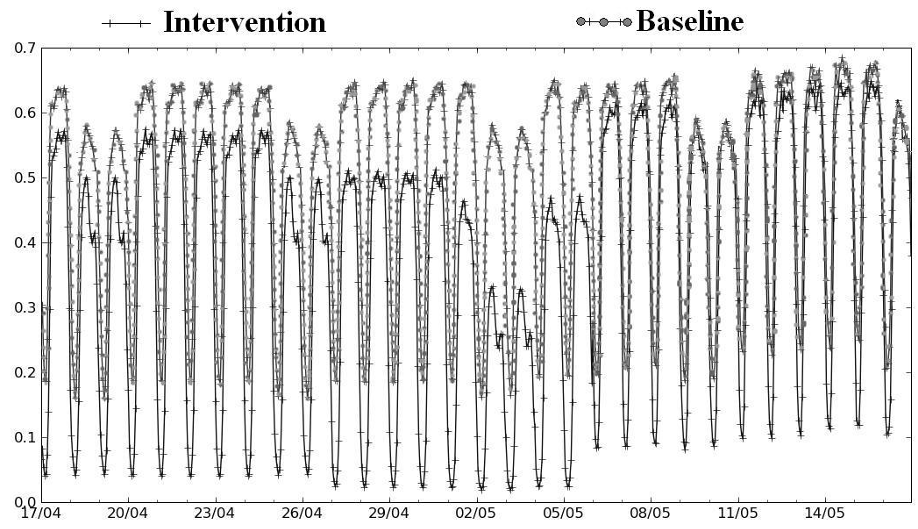
1. Mobility Reduction
The data revealed a massive shift in behavior. During the "Shutdown" phase (May 1-5), mobility dropped by up to 30% compared to the baseline.
2. Flattening the Curve
The simulation results were striking. The intervention didn't just reduce the total number of cases; it reshaped the epidemic curve.
- Peak Reduction: 10% fewer people were infected at the height of the crisis.
- Peak Delay: The peak was pushed back by 40 hours, a critical window for distributing vaccines or medical supplies.
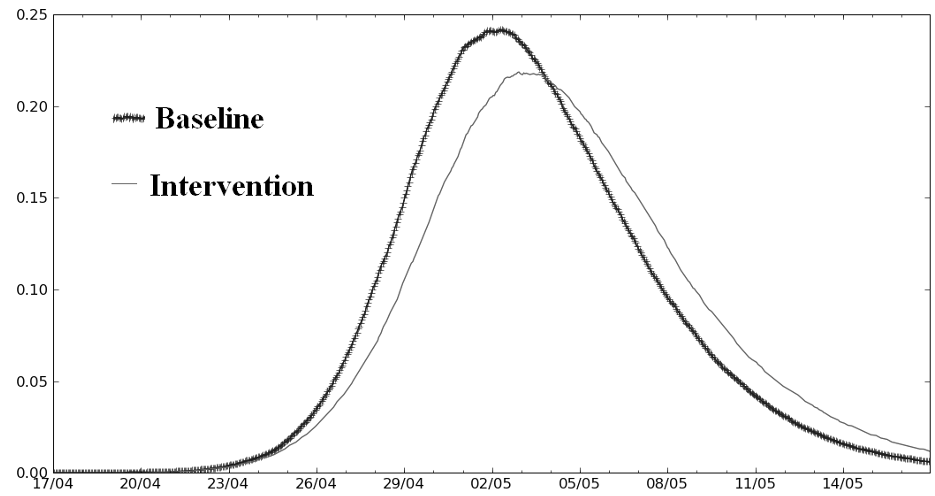 Fig 5: The blue curve (Intervention) shows a lower and later peak compared to the red baseline.
Critical Analysis & Conclusion
This work demonstrates that passive sensing via cellular networks is a powerful tool for public health. By capturing how people actually moved during the H1N1 alert, the authors moved ABM from a theoretical exercise to a data-driven validation tool.
Limitations:
- Spatial Resolution: Using BTS locations is coarse; it only knows which tower you are near, not your exact room or building.
- Demographics: The model does not yet account for age or socio-economic status, which significantly impact both mobility and biological vulnerability.
Takeaway: Real-time behavioral data is the "missing link" in epidemic modeling. For future pandemics, integrating CDR-like data into ABMs will allow governments to simulate the effects of social distancing as they happen, rather than relying on retrospective analysis.