
Seeing the Water: How Satellites Reveal Irrigation's Hidden Impact on Local Climate
7353_Agricultural Irrigation Impacts on Land Surface Characteristics Detected From Satellite Data Products in Jilin Province, China.
This study investigates the impact of agricultural irrigation on land surface attributes in Jilin Province, China, using multi-source satellite data (MODIS, AMSR-E, GEWEX). By comparing areas with different irrigation intensities, the authors demonstrate that satellite observations can effectively detect and quantify biogeophysical changes such as cooling effects and moisture increases.
TL;DR
Agriculture isn't just about food; it's a massive geoengineering project. This study by Zhu et al. utilizes a decade of satellite data to prove that irrigation in Jilin Province, China, fundamentally reshapes land surface characteristics. By comparing highly irrigated "Target" zones with "Reference" zones, the researchers quantified a significant cooling effect and increased moisture levels, validating satellite remote sensing as a superior tool for monitoring human-induced environmental change compared to traditional, often biased, ground stations.
Background: The Limits of Ground Truth
For decades, our understanding of how irrigation affects climate—specifically the Irrigation Cooling Effect (ICE)—came from two sources: sparse weather stations and complex computer models. Both have flaws. Models are only as good as their inputs, and weather stations provide "point measurements" that might be skewed by nearby urbanization. In China, where cities are swallowing up rural landscape, the signal of a cooling irrigated field is often drowned out by the noise of a warming city.
The researchers asked: Can we bypass the ground noise and see the impact directly from space?
Methodology: The "Reference vs. Target" Framework
To isolate the impact of irrigation, the authors didn't just look at absolute values; they looked at differences.
- Land Cover Filtering: Using a 1km National Land Cover Dataset (NLCD), they isolated cultivated land.
- Intensity Grading: They used FAO irrigation maps to categorize these fields into Reference Areas (RA) (<10% irrigated) and Target Areas (>30% or >50% irrigated).
- Multi-Sensor Fusion: They synchronized Albedo and LST (MODIS), Soil Moisture (AMSR-E), and Radiation (GEWEX) datasets to a common 0.05-degree grid.
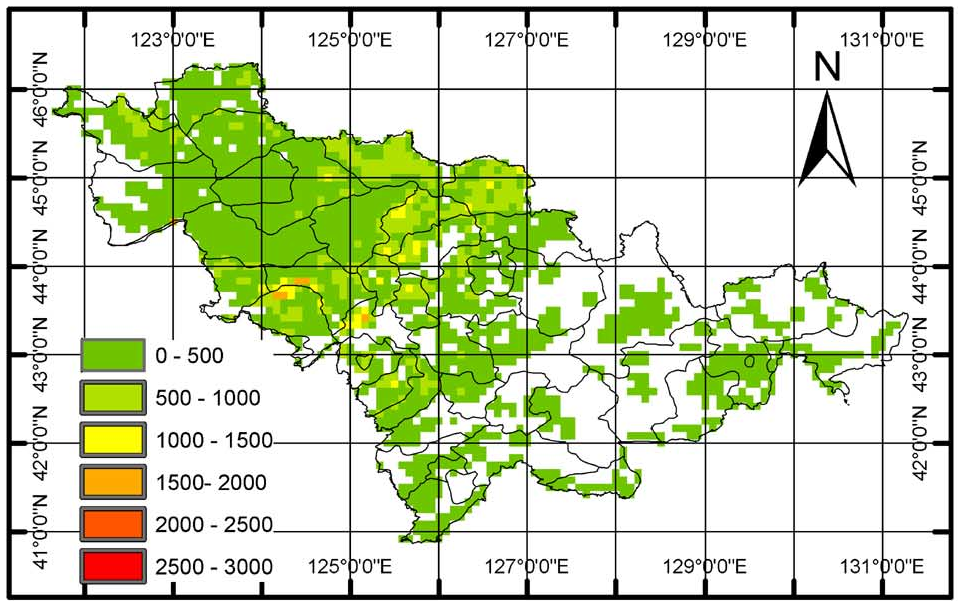 Note: The study area in Jilin Province serves as a critical agricultural hub for corn, rice, and soybean.
Methodology - The Core Biogeophysics
The study tracks five key parameters. The physical intuition is elegant:
- Albedo: Wet soil is darker. Therefore, irrigation should decrease the Earth's reflectivity (Albedo).
- LST & ET: Irrigation provides water for Evapotranspiration (ET). As water evaporates, it consumes energy (latent heat), which would otherwise heat the soil (sensible heat). This results in a "cooling" effect on Land Surface Temperature (LST).
- NDVI: Better water access leads to healthier, greener crops, boosting the vegetation index.
 Fig 2: Time series showing the seasonal synchronization of ET, LST, and Soil Moisture.
Experimental Results: Quantifying the Human Fingerprint
The results provide a clear quantitative confirmation of the irrigation impact.
1. The Cooling Effect
In the peak growing season (June-August), highly irrigated areas (Target 2) were consistently cooler than their non-irrigated counterparts. This isn't just a minor fluctuation; the LST difference is a direct result of the energy partitioning mentioned earlier.
2. The Moisture Bonus
Soil moisture in irrigated areas peaked in April (pre-sowing irrigation) and remained higher throughout the summer. This surplus moisture fueled a massive jump in Evapotranspiration, effectively turning the agricultural fields into "local air conditioners."
3. The Albedo Dip
The study found that Visible (VIS-BB) and Shortwave (SW-BB) albedo decreased in irrigated areas. Because wetter surfaces and dense canopies absorb more solar radiation, the "rebound" of energy into space is reduced.
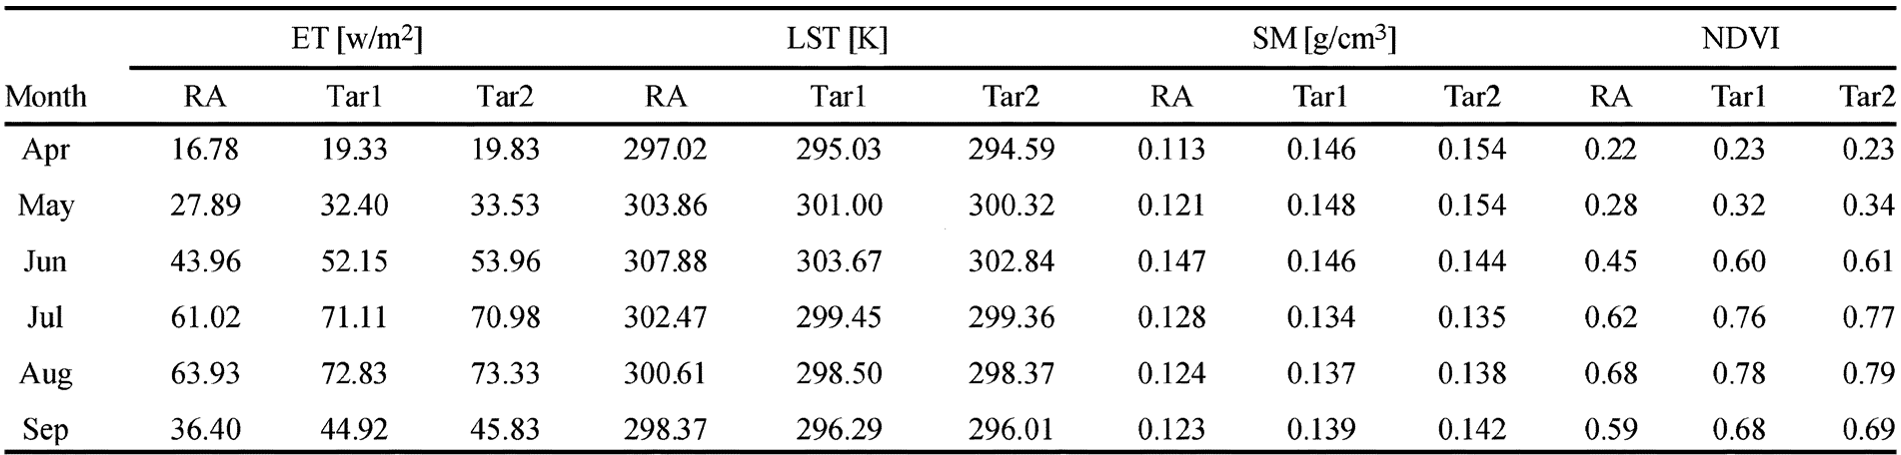 Table IV: Quantitative proof that as irrigation intensity increases (RA -> Tar1 -> Tar2), NDVI and ET rise while LST drops.
Critical Insight: Irrigation vs. Urbanization
One of the paper's most profound takeaways is the discussion on Urbanization. In China, many meteorological stations are becoming "urbanized." While urbanization increases LST (the Heat Island effect), irrigation decreases it. If we rely solely on ground stations, these two opposing forces might cancel each other out, leading researchers to conclude that irrigation has "no effect." Satellite data bypasses this by allowing us to look specifically at the pixels of farmland, away from the concrete.
Conclusion & Takeaways
This research confirms that:
- Satellites are sufficient: We don't need a sensor in every field to see the big picture.
- Irrigation Intensity Matters: The impacts on moisture and temperature scale linearly with the percentage of land equipped for irrigation.
- Local Climate Modification: Irrigation is a significant driver of local climate variability, and its signature is clearly visible in the Earth's energy budget.
Future Outlook: As we move toward 2030, using high-resolution constellations (like Planet or Sentinel) could allow us to apply this "Target-Reference" framework at the individual farm level, enabling precision water management and more accurate regional climate forecasting.