
Assessing Algorithmic Fairness: Why Your Discussion Forum Classifier Might Be Biased
Assessing Algorithmic Fairness in Automatic Classifiers of Educational Forum Posts
This study evaluates the algorithmic fairness of six common classifiers (ML and DL) used to categorize educational forum posts. By utilizing the ABROCA metric, the authors assess performance disparities across student sex and first-language backgrounds, finding that current SOTA models often disadvantage English-as-second-language (ESL) speakers.
TL;DR
In the rush to automate classroom management using AI, we often focus on accuracy while ignoring equity. This study reveals that popular classifiers for educational forum posts—from traditional SVMs to BERT-powered LSTMs—exhibit significant "algorithmic unfairness." Specifically, these models tend to favor native English speakers over ESL students. However, the study also offers a silver lining: Equal Sampling during training can drastically reduce bias without sacrificing overall performance.
Background: The Hidden Shield of Accuracy
In massive online courses, instructors rely on automatic classifiers to flag urgent student questions. While SOTA models boast high F1 scores and AUC, a critical question remains: Are these models equally accurate for everyone? If a classifier systematically ignores posts from female students or ESL learners, the AI becomes a gatekeeper of inequality.
Methodology: Benchmarking Fairness
The research team at Monash University analyzed 3,703 forum posts across disciplines like Business and Computer Science. They compared two generations of technology:
- Traditional ML: Naïve Bayes, SVM, Random Forest, and Logistic Regression (using 3,180 engineered linguistic features).
- Deep Learning (DL): Bi-LSTM and CNN-LSTM architectures utilizing BERT embeddings.
To measure "Fairness," they used ABROCA (Absolute Between-ROC Area). Unlike simple accuracy checks, ABROCA calculates the gap between the ROC curves of two groups (e.g., Male vs. Female). A lower ABROCA score indicates a fairer model.
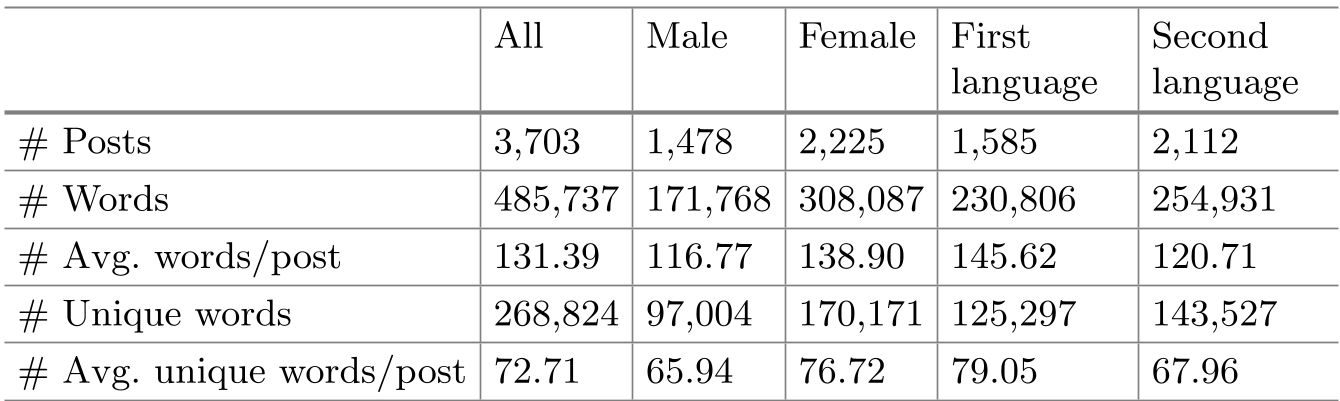 Table 1: Descriptive statistics showing differences in post length and word count across demographics.
Key Insights: Accuracy vs. Fairness
The results present a nuanced reality for AI practitioners:
1. The Accuracy-Fairness Paradox
DL models (CNN-LSTM) won the accuracy race (AUC 0.795). However, they were not the fairest. Traditional models like SVM and Logistic Regression often showed narrower performance gaps between demographic groups. This suggests that the complex "black-box" nature of DL might capture subtle biases in language proficiency more aggressively than hand-crafted features.
2. Language is a Major Bias Vector
The study found that unfairness was twice as high for language backgrounds as it was for sex. Most classifiers favored English-as-first-language students.
- Why? Most NLP tools (LIWC, BERT) are trained on standard English corpora (Wikipedia, Books). They struggle with the unique syntax and "linguistic complexity" of ESL students' posts.
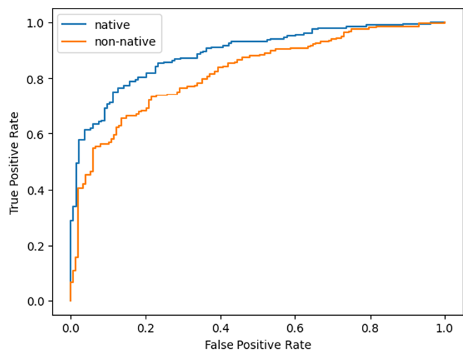 Figure 1: ROC curves showing the performance gap between English-as-first-language (solid line) and English-as-second-language (dashed line).
3. The Power of Equal Sampling
By simply ensuring the training set had an equal number of posts from each demographic, the researchers saw a massive improvement.
- Result: Naïve Bayes saw a 61% reduction in unfairness.
- Takeaway: Data representation matters more than model complexity for fairness.
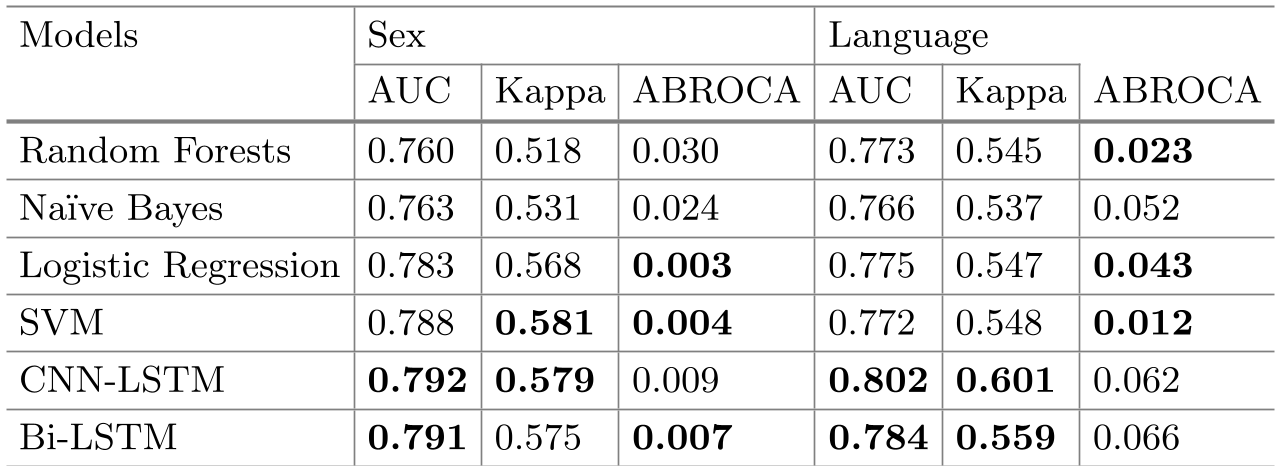 Table 3: Fairness significantly improves (lower ABROCA) across most models when using equal training samples.
Critical Analysis & Conclusion
The Future of "Inclusive AI" in Education
This paper serves as a wake-up call for EdTech developers. It proves that a "strict performance-for-fairness trade-off" is a myth—you can have both if you balance your data.
Limitations: The study only looked at binary classifications (relevant vs. irrelevant) and focused on a limited set of demographics. Future research must tackle "Intersectionality" (e.g., a female ESL student) and expand to more varied datasets.
Final takeaway: When building educational AI, stop only looking at the leaderboard. Inclusion is a metric that belongs on the dashboard alongside Accuracy and Loss.