
Mapping the Digital Divide: Decoding Political Bias in Alternative Media via Facebook Insights
Identifying and Characterizing Alternative News Media on Facebook
This paper presents a graph-based semi-supervised learning framework to identify and measure the political bias of Facebook pages. The method, validated on U.S. datasets and applied to the Brazilian news ecosystem, successfully characterizes the ideological divide between alternative media, mainstream media, and public figures.
TL;DR
As news consumption shifts from traditional outlets to social media, "alternative media" has become a powerful force in shaping public opinion. This paper introduces a scalable, semi-supervised graph method to measure the political bias of Facebook pages. By analyzing audience overlaps rather than just content, the researchers successfully mapped the ideological landscape of Brazil, revealing that alternative media serves as a critical counter-weight to a largely right-leaning mainstream media environment.
The "Black Box" of Alternative Media
Traditional journalism (Mainstream Media) is relatively easy to categorize. However, the rise of independent "alternative" outlets—often operating without official press credentials—creates a transparency gap. Why is this a problem?
- Scale: Thousands of pages self-report as "news" on Facebook.
- Data Silos: High-quality political demographic data is often restricted to U.S.-based users.
- Nuance: Public figures (like politicians) now act as primary news sources, further blurring the lines of "journalism."
The authors' insight was simple yet profound: You are what you like. By looking at which audiences follow which pages simultaneously, they can infer a shared ideological "neighborhood" without reading a single article.
Methodology: From Audience Affinity to Graph Propagation
The core of the paper is a transition from raw marketing data to a mathematical graph.
1. The Normalized Affinity Score
To compare pages across different audience sizes, the authors defined a new metric, . This score accounts for the "Monthly Active People" (MAP) of both pages and the specific intersection of their followers.
2. Graph Construction and Label Propagation
Using this affinity score, they built a graph where:
- Nodes: Facebook Pages.
- Edges: Weighted by "Distance" (the inverse of affinity).
- SSL Engine: They tested several algorithms, concluding that Smooth Label Propagation (Smooth LP) provided the best balance of accuracy and consistency.
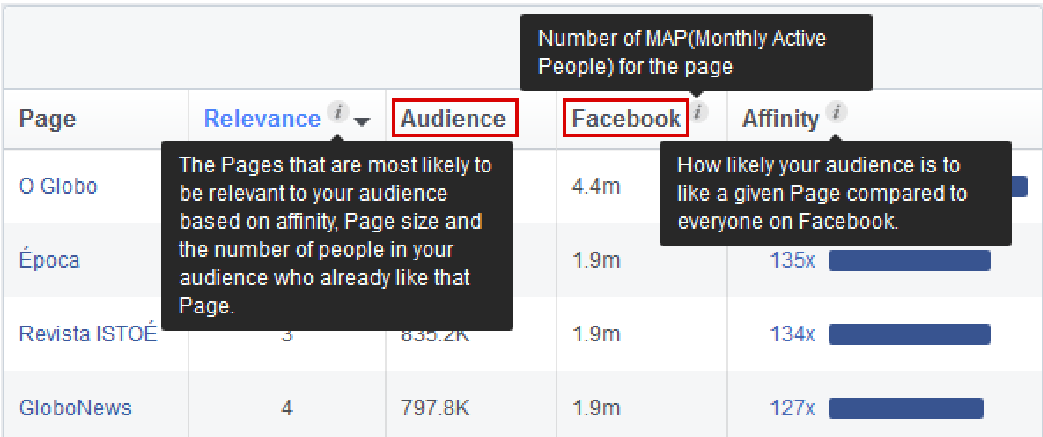 Fig 1: The Facebook Audience Insights interface used to extract raw affinity data.
Global Validation: Performance in the U.S.
Before applying the method to Brazil, the authors validated it against four prestigious U.S. benchmarks (Pew Research, Science/Bakshy, etc.). The results showed a high Pearson’s r (0.8 on average) with audience-based datasets, proving that the tool accurately captures the "perceived" bias of an outlet's readership.
| Method | Smooth LP | SGT | KNN |
|---|---|---|---|
| Bakshyet al. (Science) | 0.8353 | 0.8483 | 0.8204 |
| Ribeiro et al. (ICWSM) | 0.8225 | 0.6266 | 0.8263 |
| Table 1: High correlation coefficients demonstrate the method's reliability. |
Case Study: The Brazilian Landscape
Applying this to Brazil yielded fascinating results. Unlike the U.S., where mainstream media is often split, the Brazilian ecosystem showed a unique structure:
- Mainstream Media: Primarily Right-leaning (often due to historical pro-business ties).
- Alternative Media: Primarily Left-leaning (often emerging as grassroots activism against right-wing governments).
- Public Figures: Highly polarized with a slight Right-wing edge in terms of total pages.
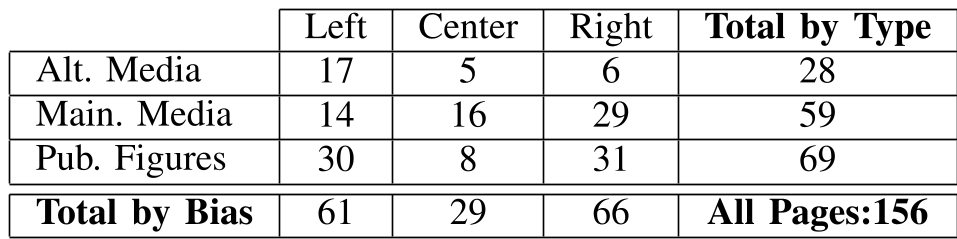 Fig 2: Distribution of Brazilian pages by type and political bias.
Critical Insight & Conclusion
This work demonstrates that structural social data (who follows whom) is often a more reliable signal of political bias than content analysis (what is written), especially as actors become more sophisticated at masking their rhetoric.
Limitations: The method relies on the "Facebook Marketing API," meaning it is subject to the platform's data transparency policies. If Facebook restricts "Audience Insights" further, this methodology would require shifting to other proxy signals.
Takeaway: For researchers and policymakers, this framework offers a way to "see" the ideological structure of a country’s digital town square in real-time, providing a vital tool for understanding how polarization evolves outside the Western context.