
Decoding the Carbon Footprint of Crowds: Multimodal Fusion for Urban Impact
Analysing environmental impact of large-scale events in public spaces with cross-domain multimodal data fusion
The paper introduces a cross-domain multimodal data fusion framework to quantify the environmental impact of large-scale social events (e.g., the 2012 Olympics). It combines latent topic extraction from Twitter via Twitter-LDA with unsupervised pollution anomaly detection using Kolmogorov Complexity (KC) scores.
TL;DR
Researchers have developed a system that "listens" to the pulse of a city through Twitter and "senses" its lungs through air quality sensors. By fusing these two worlds, they proved that social events like the Olympic Opening Ceremony have a quantifiable, statistically significant impact on local NO2 levels, specifically along major transit arteries.
Context: This work moves beyond simple "Urban Computing" into the realm of Physical-Social Fusion, providing a mathematical bridge between what people say (unstructured text) and what environment sensors measure (structured time-series).
The "Semantic Gap" in Smart Cities
Why is it so hard to tell if a parade caused a pollution spike?
- Modality Mismatch: Sensor data is a stream of ratios (numbers); Social media is a stream of nominals (words).
- Baselines: Pollution varies by season and weather, making simple threshold-based anomaly detection useless.
- Spatial Sparsity: Not every street has a sensor, and not every citizen tweets their GPS coordinates.
Previous SOTA methods used Twitter merely as a "caption" for sensor graphs. This paper treats social media as a numerical feature that can be directly correlated with atmospheric chemistry.
Methodology: Bridging Text and Numbers
The framework utilizes a three-stage pipeline: Extraction Transformation Fusion.
1. Social Discovery (Twitter-LDA)
To turn millions of tweets into data, the authors use Twitter-LDA. Unlike standard LDA, Twitter-LDA assumes one tweet covers one topic. Through Gibbs Sampling, they identify specific "Event Topics" (e.g., T36: "Opening Ceremony").
2. Physical Anomalies (Kolmogorov Complexity)
To detect "episodes" without needing a pre-trained model, the authors use Kolmogorov Complexity (KC). It measures how "random" or "complex" a data point is relative to others. A sudden NO2 spike has high complexity compared to the regular diurnal cycle of the city.
 The tripartite architecture: Social Event Detection (Left), Pollution Extraction (Middle), and Correlation Fusion (Right).
Experimental Results: The Olympic Case Study
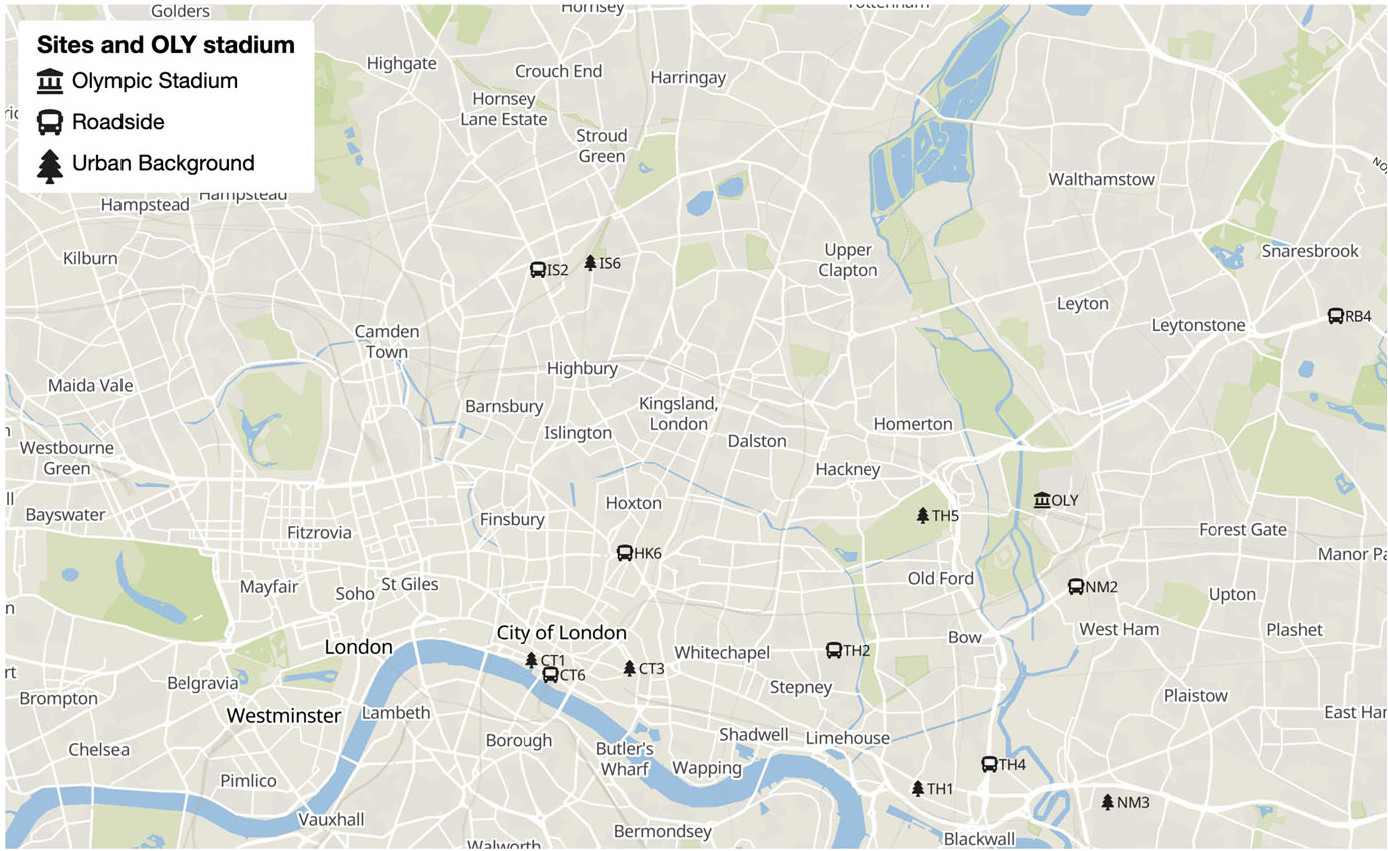
Using 1.6M tweets and data from 13 London monitoring sites during the 2012 Olympics, the authors validated their model.
- The "Vocal" Peak: Twitter activity peaked sharply during the Opening and Closing ceremonies.
- The "Dirty" Truth: Roadside sensors on the A11 and A12 (the main arteries to the Olympic Park) showed a Pearson correlation of 0.70 with Opening Ceremony tweets.
- Urban Background vs. Roadside: Interestingly, sensors located in parks (Urban Background) showed minimal correlation, proving that the environmental impact of large events is primarily a transport-driven localized phenomenon.
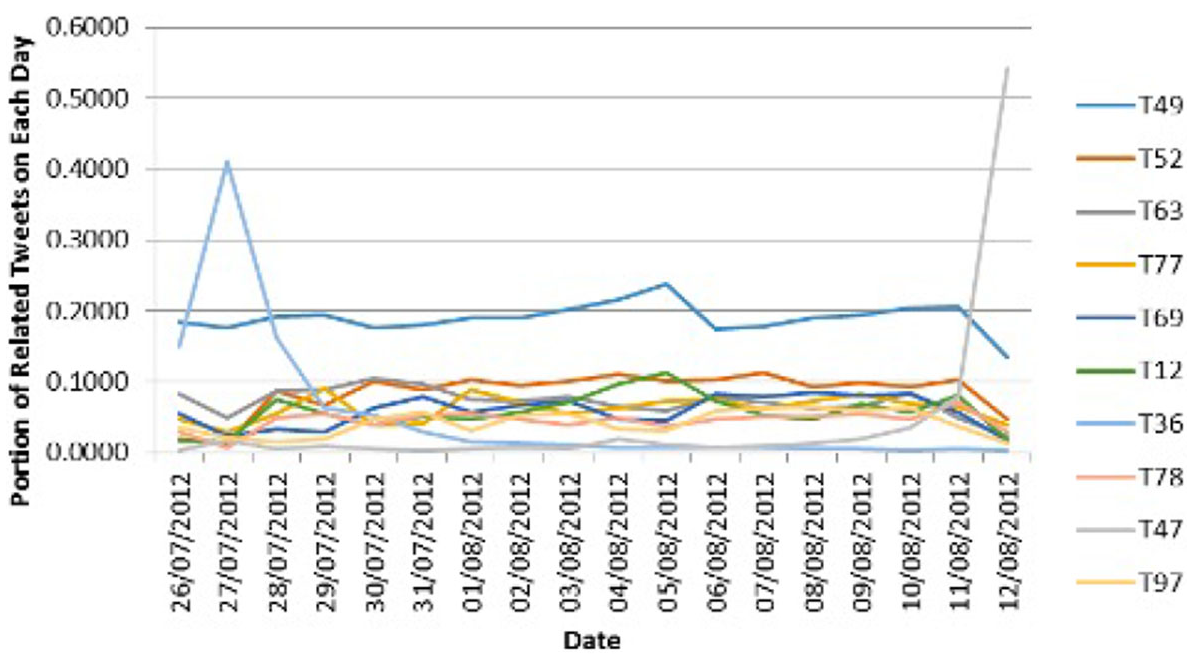 Figure: Spikes in specific topics (T36, T47) align perfectly with known historical events, providing the temporal anchor for fusion.
Critical Insight & Future Outlook
The brilliance of this paper lies in its unsupervised nature. By using KC-scores and LDA, the system can be dropped into any city (Paris, Tokyo, New York) without needing years of labeled "training" data.
Limitations:
- The system relies on the Twitter Search API, which may face data access restrictions in the "X" era.
- It doesn't yet account for weather-driven dispersal (wind speed/direction), which could "shift" the pollution from the event site to a different borough.
The Takeaway for City Planners: Social media isn't just for PR; it's a high-resolution, real-time indicator of human mobility that, when fused with IoT sensors, can predict health risks for citizens before the official environment reports are even filed.