
Decoding the Flow: Statistical Laws of Information Exchange in VKontakte
Analysis of the Implementation of Information Exchange Algorithms in Social Networks
This study investigates the statistical patterns of information exchange in the "VKontakte" (VK) social network by classifying communities into four categories: marketing, political, blogging, and individual. The authors synthesized regression models and confirmed that "relative views" is the most robust predictor for user activity, achieving determination coefficients () between 0.73 and 0.86.
TL;DR
Social networks are more than just digital spaces; they are complex environments governed by specific statistical laws. By analyzing 150 days of data from the VK network, researchers have discovered that while most engagement metrics are volatile, "Relative Views" serves as the ultimate signal for predicting user activity. They achieved a high prediction accuracy (up to 0.86 ) by factoring in community types and aggressive marketing outliers.
Background: Beyond the 24-Hour Window
Most existing research focuses on viral "bursts"—how info spreads in a day. This paper argues that understanding the evolution of a community requires a long-term lens. By categorizing communities into Marketing, Political, Blogging, and Individual, the authors move beyond a one-size-fits-all approach to social media modeling.
Problem & Motivation: The Chaos of Long-Term Data
Over short periods (50-100 days), data likes to follow a Normal Distribution. However, as time passes, the "mean" and "variance" shift. This makes long-term forecasting difficult.
The authors' core insight: Aggressive Marketing acts as a statistical "shocker." It breaks regular patterns. To prove this, they created their own VK community, "Youth Fever," and intentionally ran aggressive campaigns to observe how they distorted the anticipated normal law distribution.
Methodology: The "Relative Views" Insight
The researchers tracked subscribers, likes, reposts, and comments. Through regression analysis, they found that "Relative Views" acts as an integral reflection of all other activities.
Modeling Political Action
A unique challenge was predicting "active supporters"—those who actually show up to real-world political events. Standard regressions failed here until the authors introduced Fictitious Variables (e.g., whether an event was "concerted" or "unconcerted"). This adjustment transformed "noisy" data into a highly predictive model.
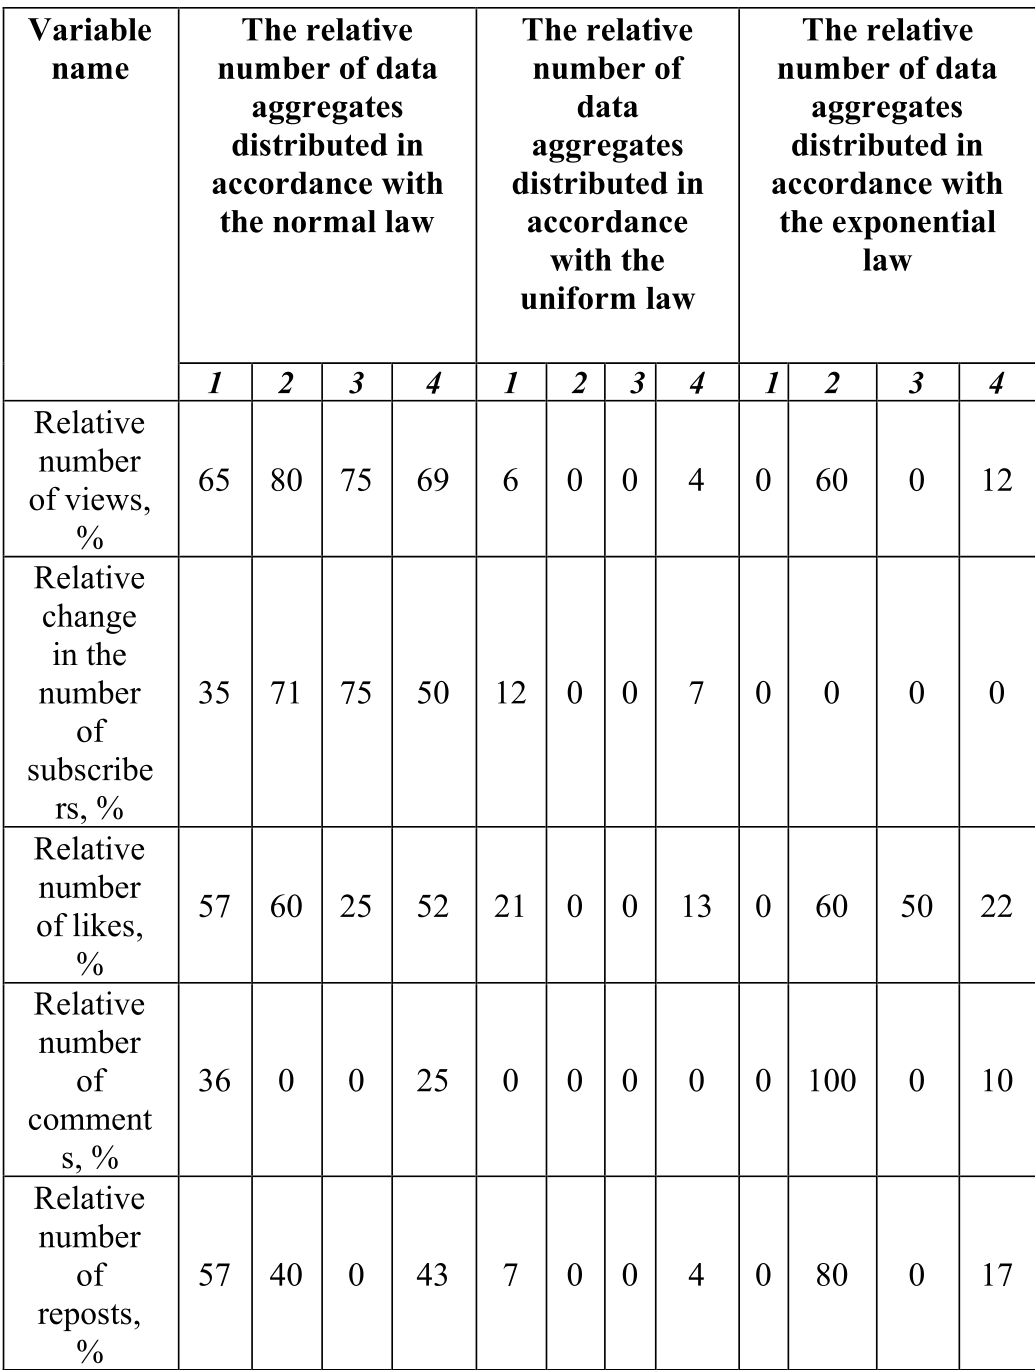 Figure 1: Comparison of data aggregates following Normal, Uniform, and Exponential laws across different community types.
Experiments & Results: The Power of Regression
The authors found a massive disparity between community types:
- Marketing & Political groups behaved similarly because both seek "active supporters" (buyers or voters).
- Blogging groups were outliers, often lacking the stabilized statistical relationships found in targeted campaigns.
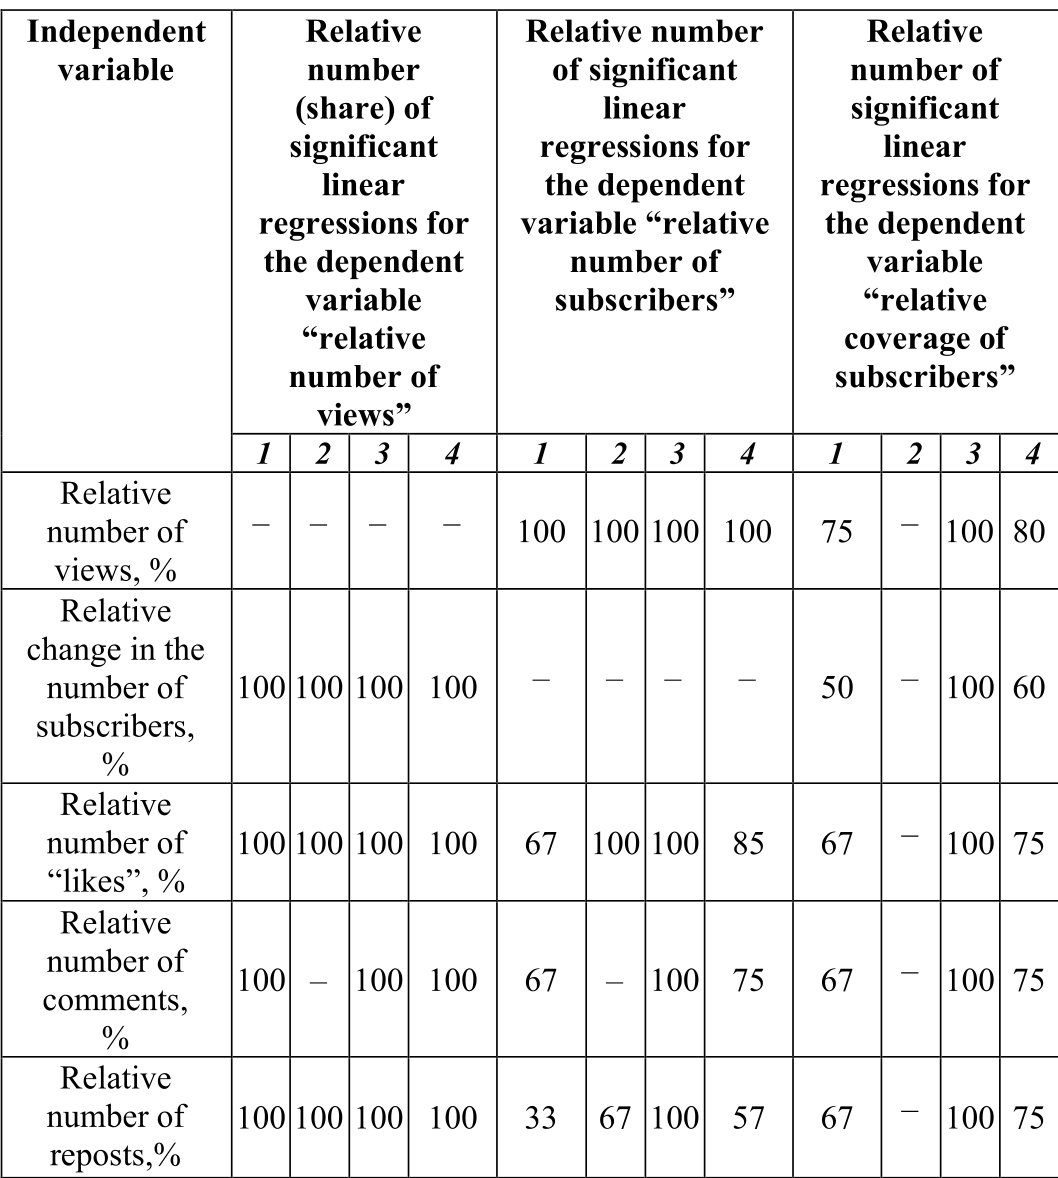 Figure 2: Analysis of determination coefficients over long intervals (150-500 days), showing the dominance of "Relative Views" as a predictor.
Key quantitative takeaway: In 81.4% of cases, the models achieved a determination coefficient (R²) of up to 0.73, proving that social network evolution is far from random—it is mathematically structured.
Critical Insight & Conclusion
The Takeaway
If you want to know how many people will actually buy a product or join a protest, stop looking at subscriber counts. Look at "Views" and "Likes" relative to the previous day’s baseline.
Limitations
While the models are robust, they rely on "fictitious variables" for political context, which suggests that the purely digital data isn't enough—you still need real-world context (like the legal status of an event) to make the math work.
Future Outlook
This work sets the stage for Simulation Models. By knowing that data typically reverts to a normal distribution once a "marketing shock" ends, developers can build AI that detects when a community is being artificially manipulated versus growing organically.