
Analyzing the Digital Pulse: Inside the Facebook Friend Circle
An analysis of friend circles of Facebook users
The paper presents a comprehensive empirical analysis of Facebook "friend circles" by monitoring 16 volunteers over a 15-day period using a custom API-based application. It identifies key behavioral patterns in content generation (status updates, multimedia) and online synchronization, establishing a quantitative baseline for user activity within social sub-networks.
TL;DR
Social media is less about a global village and more about your immediate "circle." This study monitors real-world Facebook usage to reveal a stark reality: we are a "silent majority" that consumes massive amounts of multimedia posted by a few active friends, primarily via mobile devices, with remarkably low levels of simultaneous online presence.
Background & Motivation
Most academic studies on Online Social Networks (OSNs) treat the platform as a massive mathematical graph. While knowing about "six degrees of separation" is useful, it doesn't help an engineer design a better Content Delivery Network (CDN) or a more private, decentralized social platform.
The authors argue that the "Circle"—the immediate neighborhood of a user—is the most relevant unit of analysis. By understanding the timing, volume, and type of data flowing within these circles, we can better understand the workload requirements for future digital interaction platforms.
Methodology: High-Resolution Monitoring
To capture the nuances of daily life on Facebook, the researchers developed a custom application utilizing the Facebook Graph API. Unlike crawlers that take static snapshots, this tool performed:
- Minutely checks for friend online status.
- Hourly checks for wall updates, photo/video uploads, and link shares.
This granularity allowed them to see not just what was posted, but the temporal rhythm of the social network.
 The tables above highlight the massive disparity between an individual's activity and the aggregate activity of their circle.
Core Insights: Patterns of Interaction
1. The Consumption Gap
One of the most striking findings is the passivity of the average user. While a user's circle might generate over 150 pieces of content daily (text, links, and photos), the users themselves uploaded almost nothing during the 15-day window. This confirms the "1% rule" of the internet—where a tiny fraction of users creates the content that everyone else consumes.
2. Multimedia Weight
Despite the rise of video, photos remained the dominant multimedia format in 2014. Interestingly, the study found that 99% of photos were under 100KB, a testament to Facebook’s aggressive (and efficient) server-side compression algorithms.
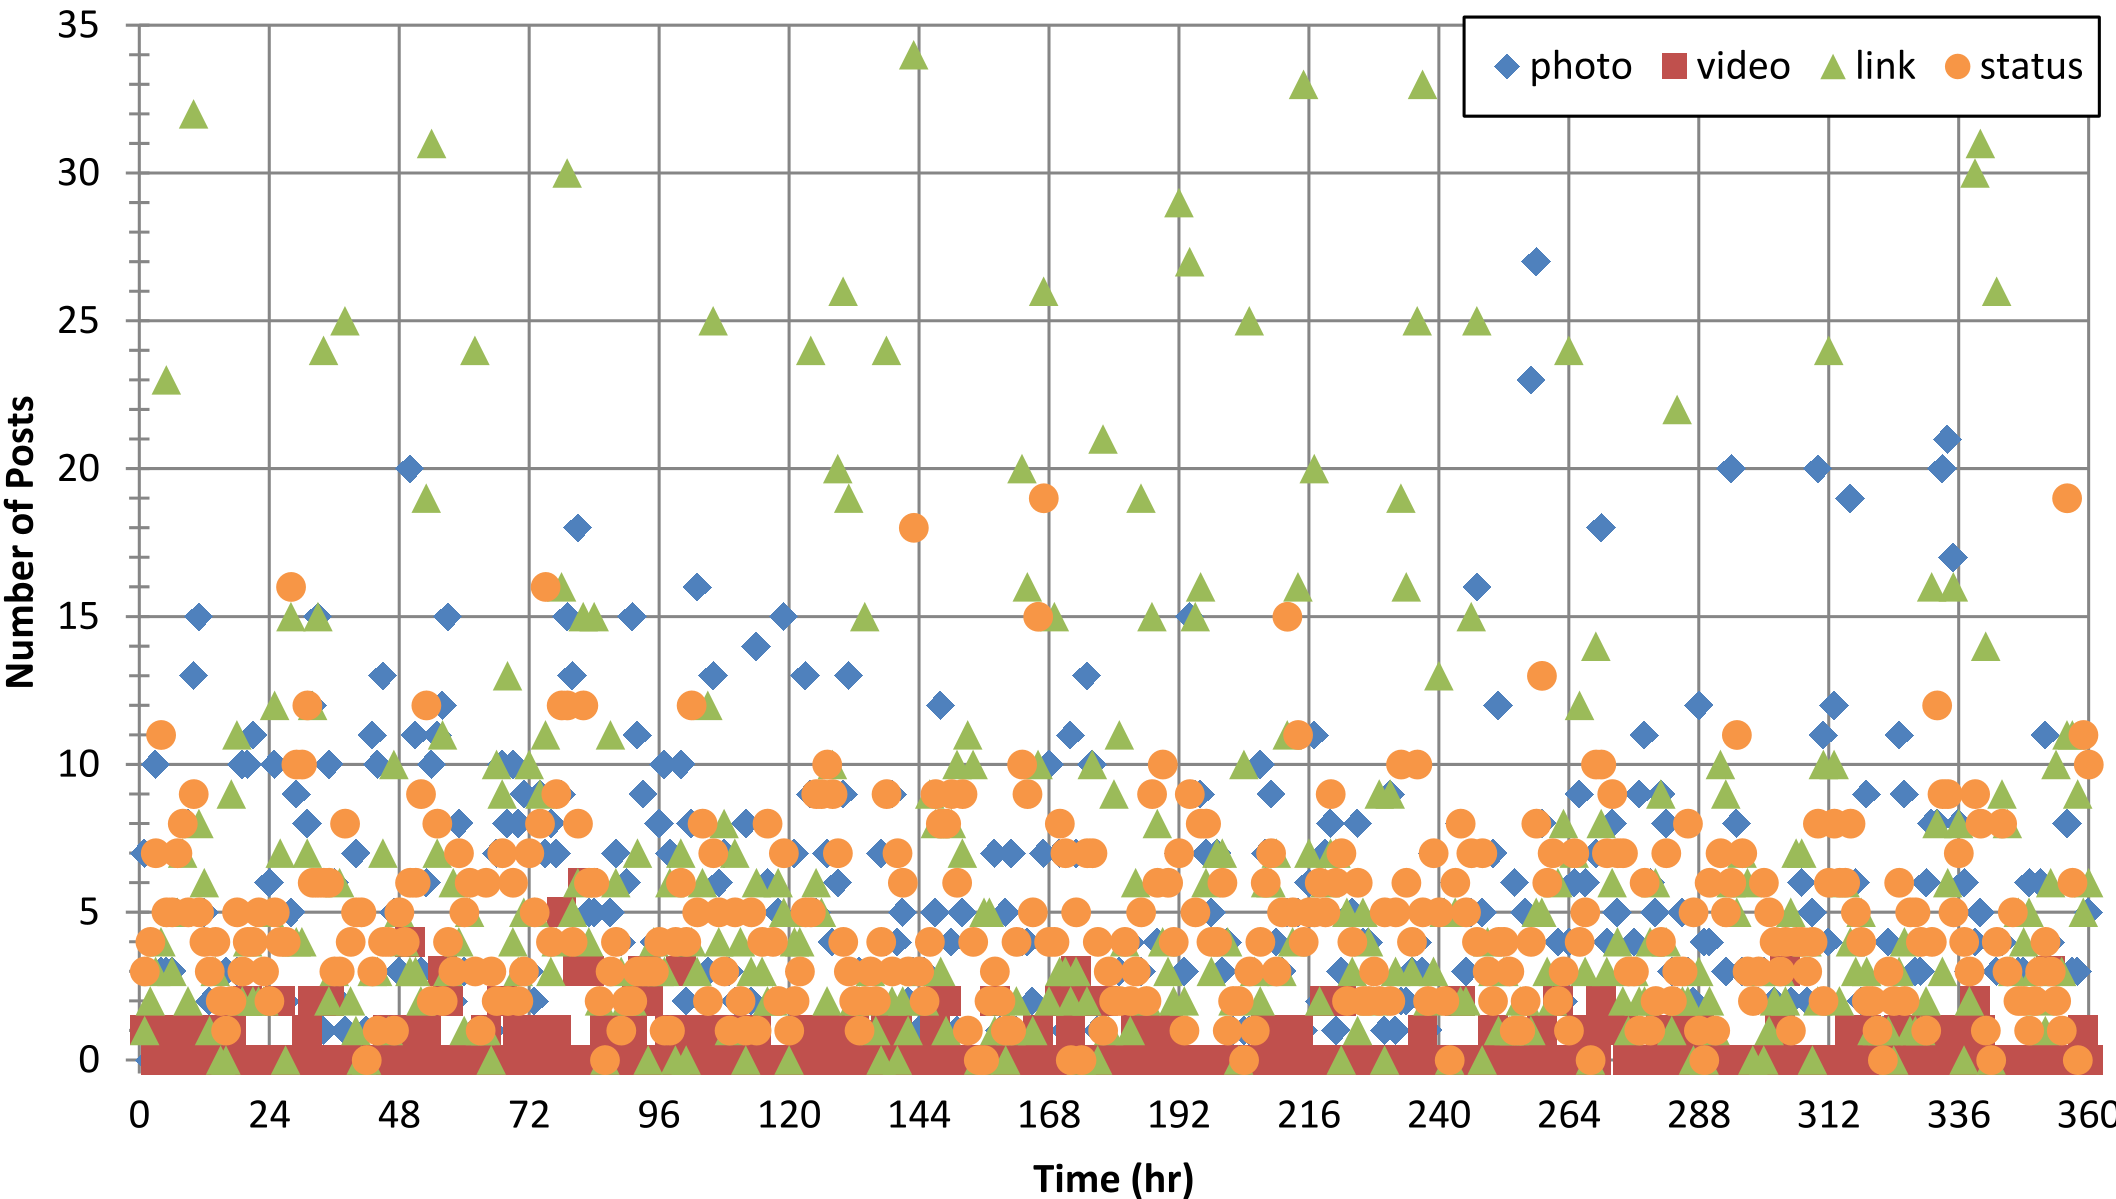 Figure 3 shows the rhythmic nature of posting, with distinct peaks that align with daily human cycles.
3. The "Online" Illusion
We often think of social networks as "always on," but the data suggests otherwise. On average, only 10% of a user's friends are online at any given minute. Even more surprising, 25% of friends were never seen online during the entire two-week study. This has massive implications for decentralized networks that rely on peers to host data; if your friends aren't online, your data might be inaccessible.
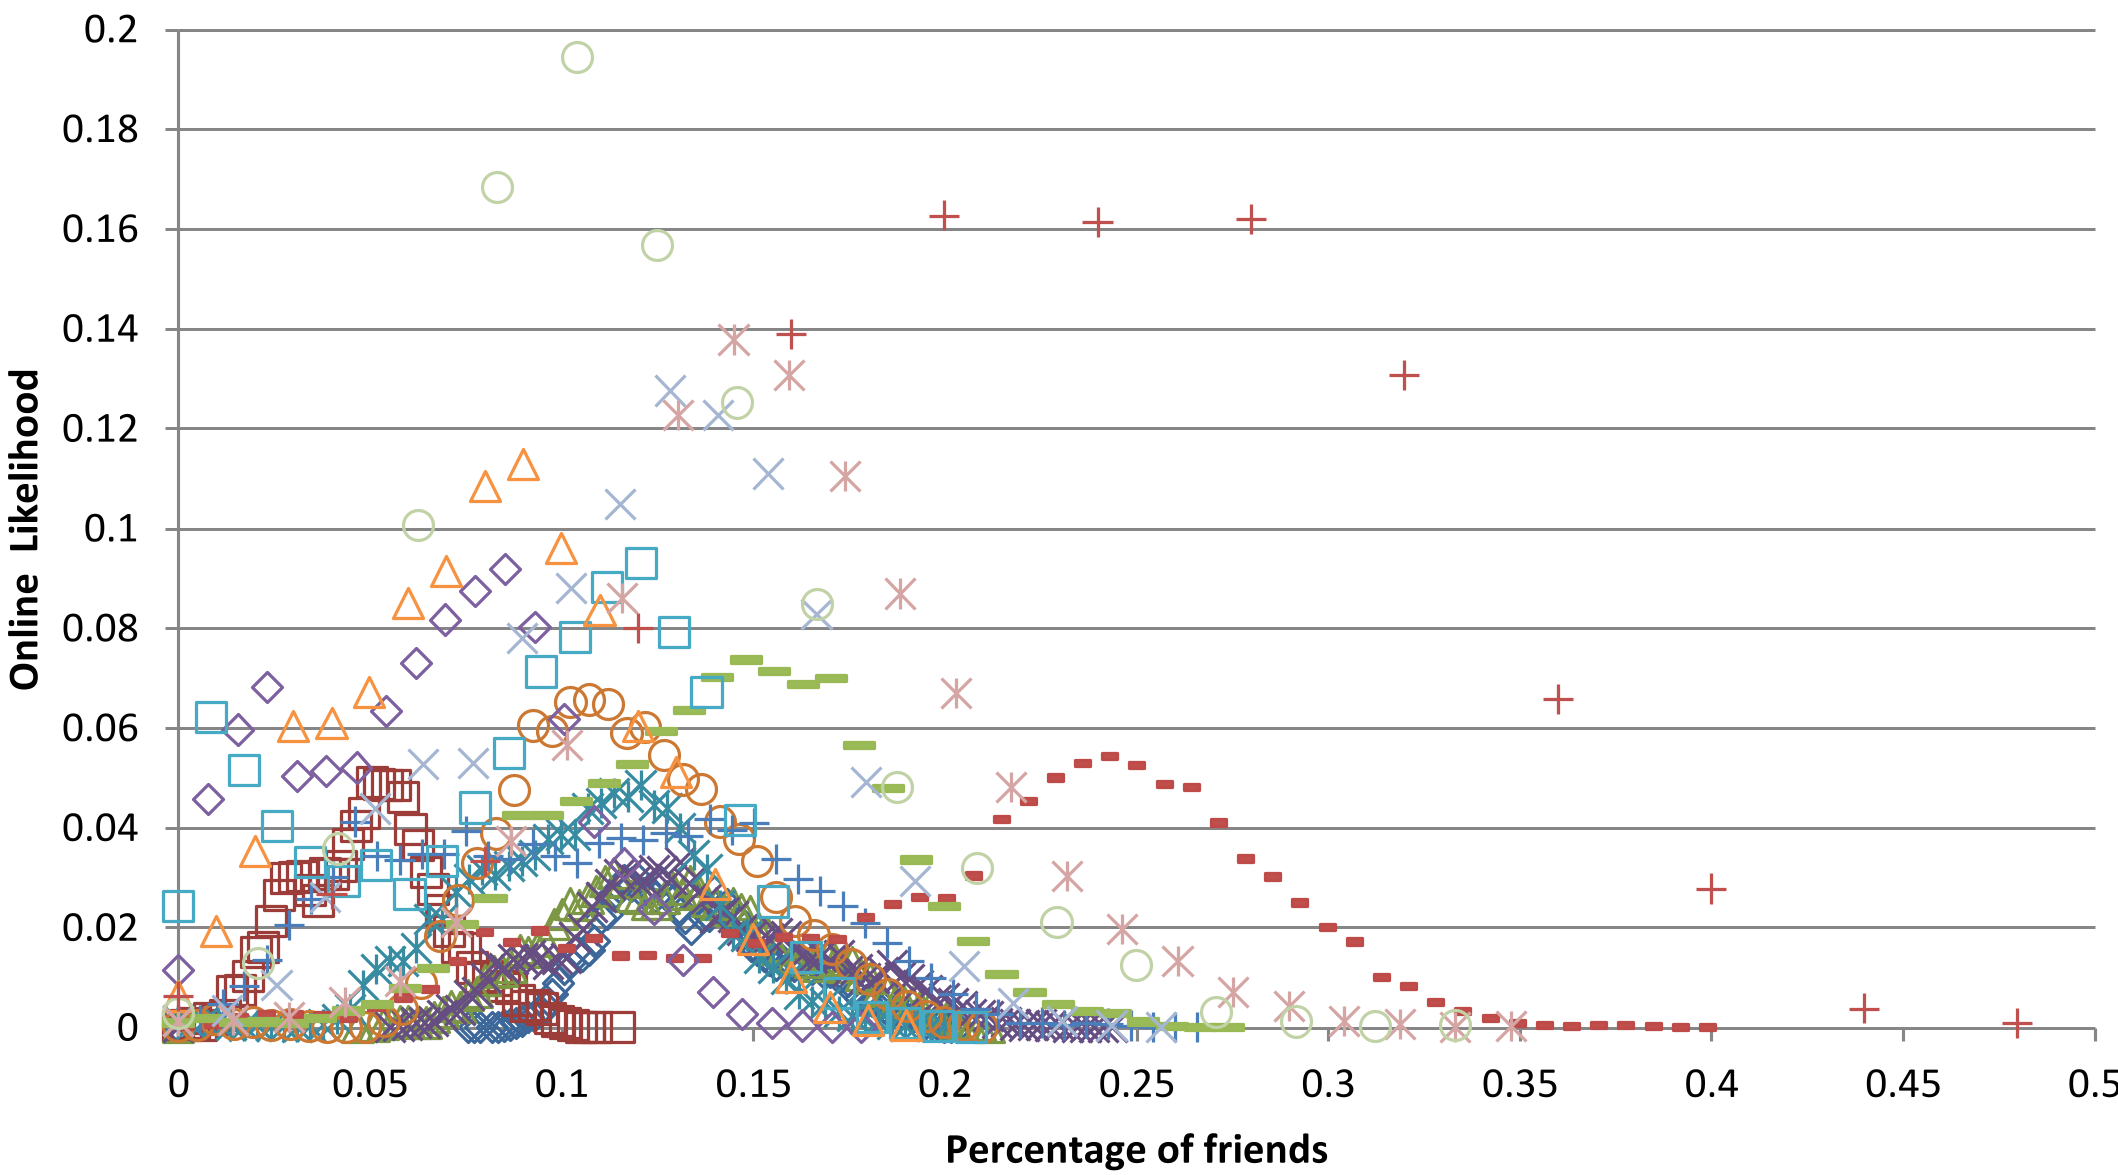 Figure 7 illustrates that for most users, less than 25% of their circle is active simultaneously, creating a challenge for real-time P2P interaction.
Critical Analysis & Future Outlook
While the sample size (16 users) is small, the study provides a rare "inner look" at the traffic demands of a social circle.
Key Takeaways for Future Tech:
- Mobile First is Absolute: With over 74% mobile usage reported even in 2014, any social platform must optimize for intermittent connectivity and data caps.
- Data Bursts: If a user doesn't log in for 24 hours, they face a "data debt" of nearly 1GB of multimedia to catch up on. Efficient sync protocols are mandatory.
- Privacy vs. Utility: The authors managed to collect this data while preserving anonymity, suggesting that "Privacy by Design" is possible even in data-intensive research.
In conclusion, the study serves as a quantitative reminder that our social digital lives are characterized by high-volume consumption of compressed media, mediated through mobile devices, within circles that are rarely online at the same time.
Limitations
The study was conducted in 2014; since then, the explosion of "Stories" (ephemeral content) and TikTok-style short-form video has likely shifted the multimedia balance significantly toward video and increased total data consumption.