
Unmasking the Influence: Network Science and Bot Detection in Twitter Trends
On the Analysis of Users Engaged in Twi er's Trend Topics
This paper presents a network science-based approach to analyze user engagement in Twitter's "Trend Topics." By modeling users as nodes and interactions (friendships and retweets) as weighted edges, the authors utilize Indegree and Eigenvector Centrality alongside Louvain Modularity to identify influential participants and detect artificial bot activities.
TL;DR
Is a Twitter trend organic or manufactured? This research leverages Complex Network theory to dissect how Trend Topics form. By analyzing user interactions through centrality measures and community detection, the authors not only identify the "true" influencers but also successfully isolate bot communities that artificially inflate content popularity.
The "Fame" Economy: Problem & Motivation
In Online Social Networks (OSNs), appearing in the "Trend Topics" list is the ultimate currency for brands and individuals seeking instant visibility. However, traditional influence models usually look at who has the most followers. The authors argue this is flawed: influence during a trend is about kinetic energy (who is driving the conversation now) rather than potential energy (static follower counts).
Furthermore, the rise of "bot-as-a-service" allows users to fake engagement. Distinguishing between a grassroots movement and a coordinated "naive artificial effort" is critical for platform integrity and marketing analytics.
Methodology: The Architecture of Influence
The researchers built a pipeline that transforms temporal Twitter data into a directed, weighted graph.
1. Weighted Interaction Graph
The system doesn't treat all connections equally:
- Follower Link: Base weight.
- Retweet (Shared Content): Double weight. This reflects the "social cost" and active endorsement of the topic.
2. Centrality Measures
- Indegree Centrality: Measures direct reach—how many people entered the trend immediately after a user did.
- Eigenvector Centrality: This is the "prestige" metric. It doesn't just count your followers; it counts how many influential people followed or retweeted you. Mathematically, it calculates the principal eigenvector of the adjacency matrix, providing a recursive definition of importance.
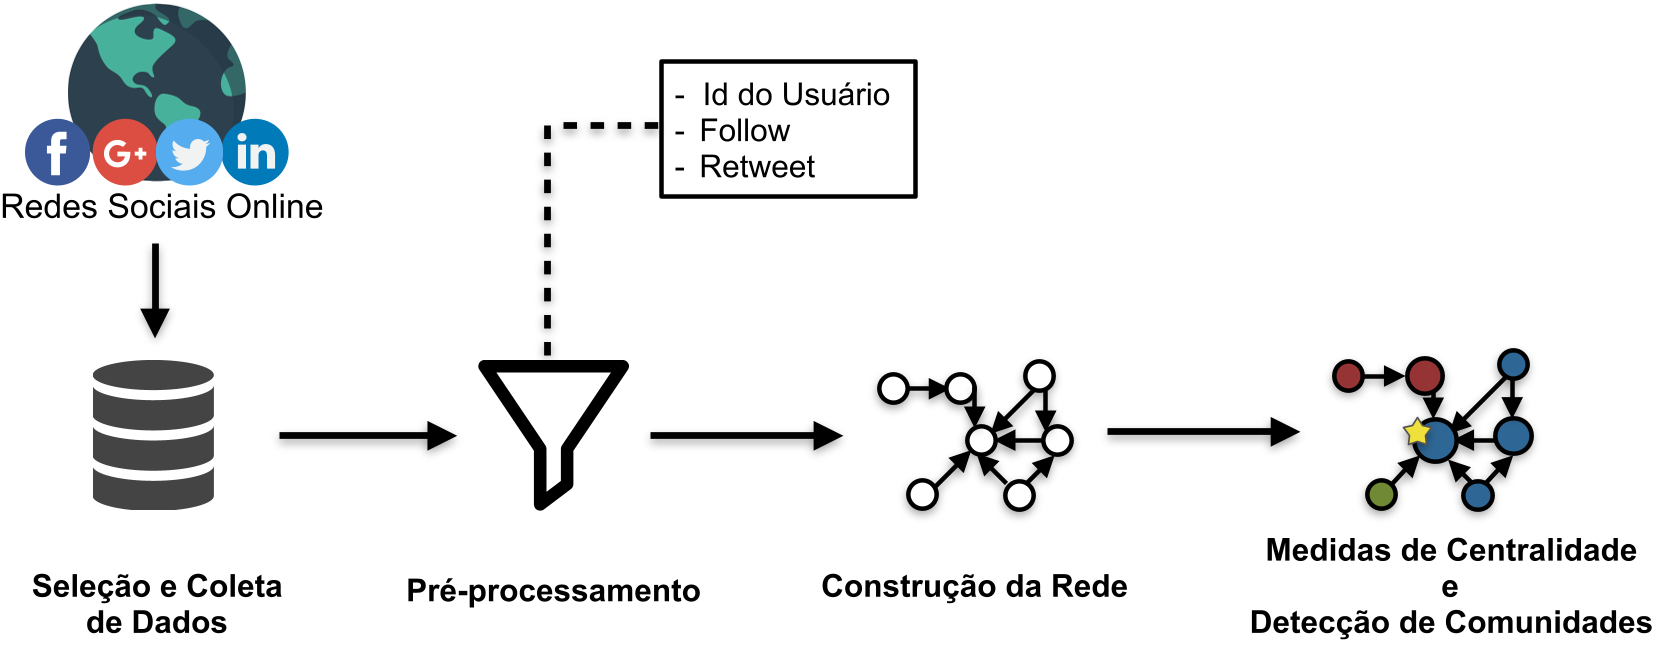 Figure 1: The proposed methodology workflow from data collection to community analysis.
Experiments: Real vs. Bot
The study focused on "SDV" (Sigo de Volta - "I follow back") hashtags, which are notorious for being gaming grounds for bots.
Community Detection and Bot Isolation
Using the Louvain Modularity algorithm, the researchers partitioned the network. They found a specific community (highlighted in blue in Figure 6) that exhibited "social clues" of being fake. These were accounts with high interconnectivity but zero natural engagement outside the trend.
 Figure 2: Experiment I Network. Node size represents Indegree, and label size represents Eigenvector centrality. The blue cluster highlights a bot community.
The "Bot Removal" Impact
In a crucial validation step, the authors recalculated influence scores after removing the identified bots.
- Top User Shift: The user "wellingtonsm34" lost a massive chunk of their Eigenvector score and dropped in rank.
- Organic Rise: The user "detremura" moved to the #1 spot, revealing them as the true organic driver of the trend.
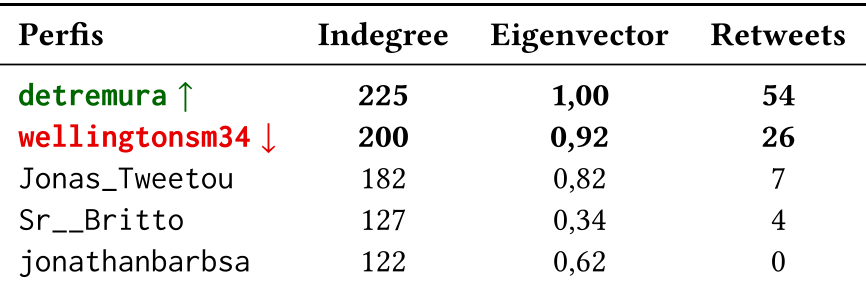 Figure 3: Influence ranking post-bot removal. Red denotes the declining "artificially inflated" user; green denotes the organic influencer.
Critical Insight & Conclusion
The study proves that structural positioning in a network is more telling than raw numbers. If a user’s influence is purely derived from a localized, hyper-dense community that doesn't bridge to other clusters, it is highly likely to be a bot operation.
Takeaways for the Industry:
- Metric Integrity: Marketers should use Eigenvector Centrality over follower counts to identify collaboration partners.
- Detection via Density: Platforms can automate bot detection by monitoring high-modularity clusters that appear suddenly during trending events.
- Limitations: The study focuses on "naive" bots. Sophisticated "cyborg" accounts (human-bot hybrids) may still require more nuanced semantic analysis to detect.
The future of trend analysis lies in the geometry of the network—understanding not just what is trending, but the shape of the crowd behind it.