
Deciphering the Digital Office: How Social Media Networks Map Enterprise Dynamics
Analyzing Enterprise Social Media Networks
This paper presents a framework for "Analyzing Enterprise Social Media Networks," utilizing tools like NodeXL to transform digital breadcrumbs (wikis, forums, emails) into actionable organizational insights. It classifies network types and introduces aggregate social metrics to automatically identify key behavioral roles such as "Answer People" and "Influencers."
TL;DR
The modern workplace is no longer defined just by the organizational chart, but by the digital footprints left on wikis, blogs, and message boards. This paper provides a rigorous framework for transforming these "social media networks" into a map of organizational health, identifying "hidden leaders" and "bridging figures" through automated graph analysis and composite social metrics.
Background Positioning
While traditional Social Network Analysis (SNA) was a manual labor of PhD-led surveys, this work acts as a bridge to the era of Computational Social Science. It moves beyond simple "friend graphs" to explore how interactions with digital artifacts (like editing a wiki) can reveal the true functional roles people play within a company—often contradicting their official titles.
The Problem: From Surveys to Streams
Historically, understanding who actually influenced a company required expensive, slow-to-update surveys. The authors argue that as enterprises move behind the firewall with social tools, we have a "live" record of interactions. However, the challenge is Noise vs. Signal: How do you differentiate a person who is simply "noisy" (high degree) from someone who is actually a "Boundary Spanner" (high betweenness) connecting two siloed departments?
Methodology: The Taxonomy of Enterprise Graphs
The authors break down enterprise networks into four critical dimensions:
- Unimodal vs. Multimodal: Does the graph connect people to people, or people to documents?
- Symmetry: Is it a "follow" (asymmetric) or a "friendship" (symmetric)?
- Weight: Does the edge represent a single click or a long-term collaboration?
- Multiplexity: Combining different platforms (email + wiki + forum) into a single "Cumulative" network.
Architecture of Interaction
The paper emphasizes the power of Bimodal Graphs (People Artifacts). By observing who edits which documents, we can derive "Indirect Symmetric" ties that reveal communities of practice that might never formally meet.
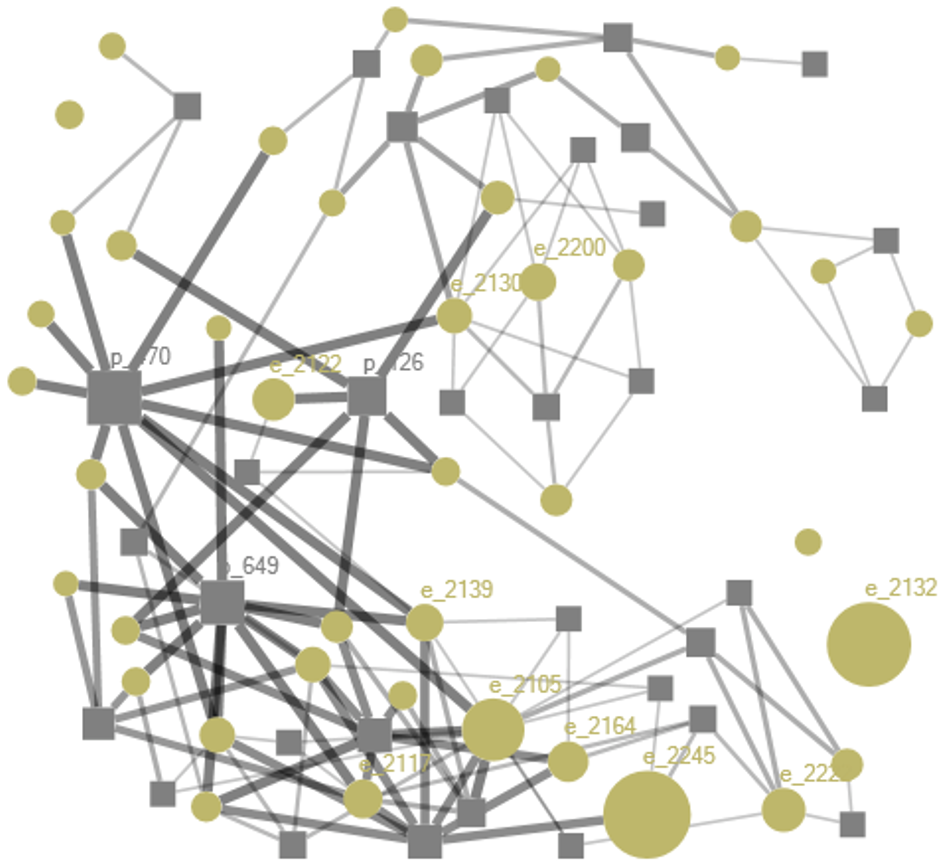 In the figure above, a bimodal graph highlights how individuals (circles) are anchored by the artifacts (squares) they create, distinguishing generalist editors from specialized contributors.
Identifying Social Archetypes
One of the paper’s most significant contributions is mapping raw math to human behavior. It defines five core roles:
- The Answer Person: High out-degree, serving as a knowledge fountain.
- The Discussion Starter: High "Initiation" scores, fueling organizational conversation.
- The Influencer: High Eigenvector Centrality—connected to other highly-connected people.
- The Boundary Spanner: High Betweenness Centrality, acting as the critical link between isolated cliques.
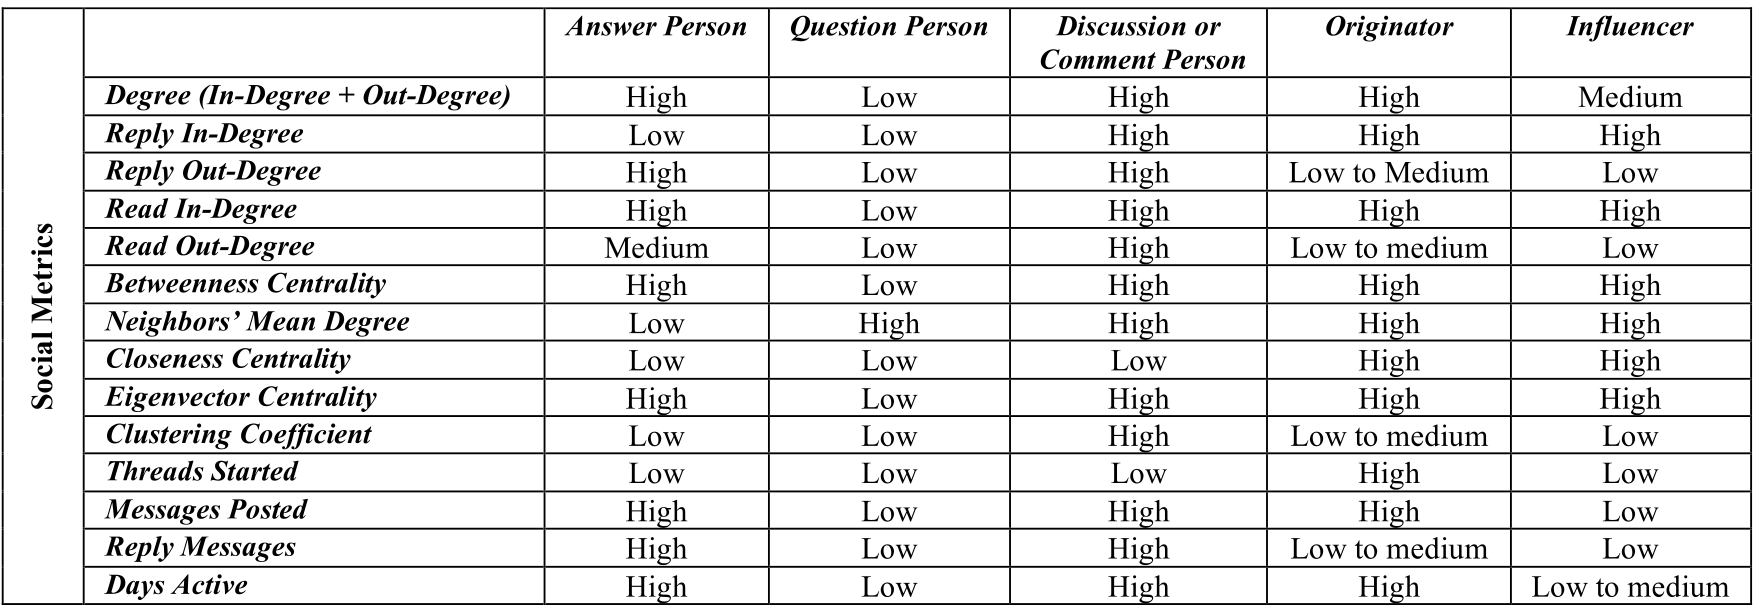 This mapping allows managers to use objective "Social Signatures" to find experts or identify groups at risk of isolation.
Experiments: Transformation and Insight
The authors demonstrate that by transforming a bimodal graph (People-Wiki) into a unimodal graph (People-People), they can apply metrics like Betweenness Centrality to find who connects the organization.
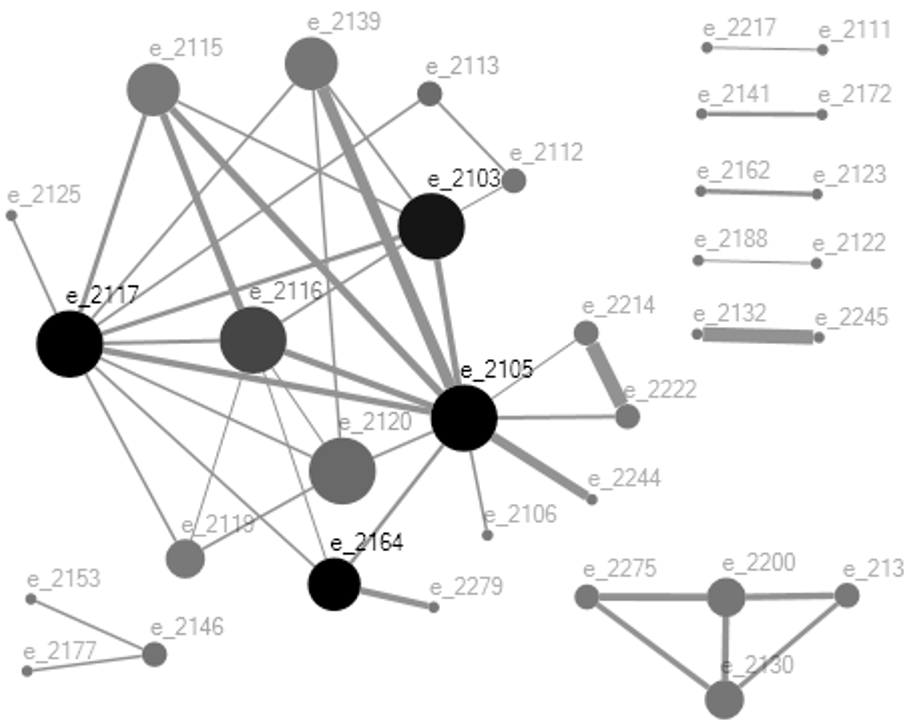 Figure 2 shows the transformed graph where node darkness indicates centrality. It reveals that an employee who seemed "average" in Figure 1 is actually the primary bridge between two distinct engineering teams.
Critical Insight & Conclusion
Takeaway
The value of enterprise social media is not the "content" itself, but the Metadata of Connection. By shifting focus from what is said to who is interacting with whom across which artifacts, organizations can optimize their internal hierarchy for better knowledge flow.
Limitations & Ethics
The authors candidly note the risk of Perverse Incentives: if employees know they are being measured by "friend counts," they may "game the system" by mass-friending others. Furthermore, they acknowledge "Hyperties"—machine-authored links based on shared location—which raise significant privacy concerns even within an enterprise context.
Future Outlook
As we move toward a hybrid work world, these "cumulative" networks will become the primary way we "see" the organization. The next frontier involves temporal analysis—watching how networks evolve over time to predict employee turnover before it happens.