
Beyond the Six-Second Loop: Decoding the Viral Mechanics of Vine
Analyzing Factors Impacting Revining on the Vine Social Network
This paper presents a comprehensive study of information diffusion on the Vine social network, specifically focusing on the "revining" mechanism. The authors leverage a dataset of 55,744 users and over 390,000 videos to analyze how content, emotions, and cyberbullying impact the depth and speed of video propagation.
TL;DR
This research provides the first deep-dive into the "revining" behavior of the (now-archived) Vine social network. By analyzing nearly 400,000 videos, the study reveals that positive emotions like "love" drive significantly deeper network propagation than negative ones. Interestingly, while cyberbullying videos attract more views (loops), they are actually less likely to be shared (revined) and travel through fewer "hops" in the social graph compared to positive content.
Background: The Infrastructure of Virality
In the landscape of social media, Vine occupied a unique niche with its 6-second looping format. Unlike Twitter's text-heavy environment, Vine's primary vector for diffusion was the "revine"—a mechanism equivalent to a retweet. The authors set out to understand why certain videos explode across the network while others remain trapped in small clusters, specifically looking at the intersection of video content, user influence, and social toxicity.
The "Revine" Paradox: Followers vs. The World
One of the most striking findings of the paper is the role of the follower. In many networks, we assume your followers are your primary audience. On Vine, however, the data tells a different story:
- The Non-Follower Dominance: For more than half of users (58%), over 90% of a video's propagation is driven by users who do not follow the original poster.
- Propagation Depth: Vine videos are surprisingly "sticky." While 85% of tweets only travel one hop (direct retweets), Vine videos commonly reach 3 hops, with some traveling as far as 16 hops.
Methodology: Mapping the Revine Tree
To visualize this, the authors reconstructed "Revine Trees." By tracing who revined what and checking follower relationships, they could see how a video moved from a "seed" user into various sub-communities.
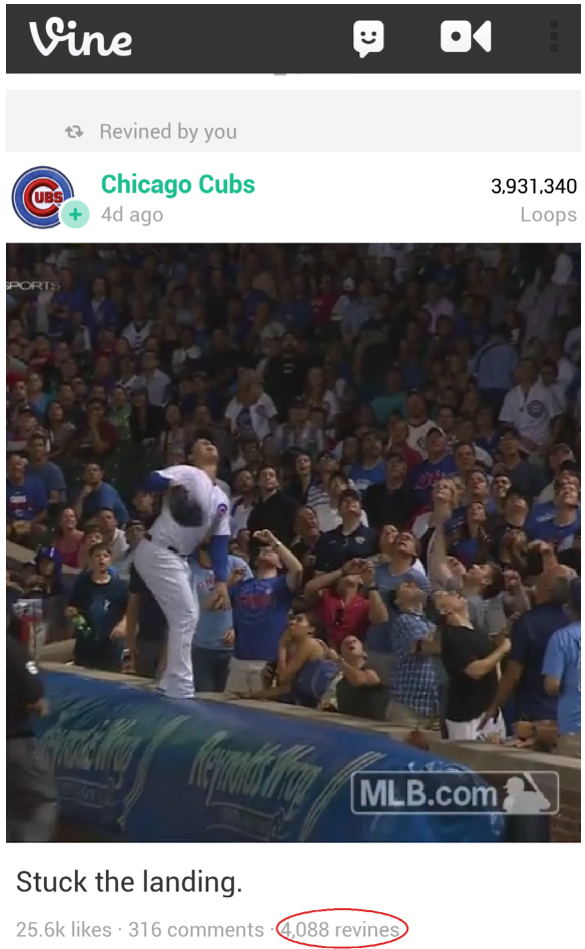 Figure 1: Visual representation of the Vine network interface, showing the loop, like, and revine mechanics.
Emotional Drivers: Love vs. Sadness
The study utilized crowdsourced labeling to categorize the emotional "vibe" of videos. The results suggest a strong Inductive Bias toward positive content in terms of sharing:
- Love & Joy: These categories boasted the highest mean number of revines and propagation depth (up to 4.4 hops).
- Sadness & Anger: While these might get attention, they are "dead ends" for diffusion. Sad videos averaged only 2.8 hops.
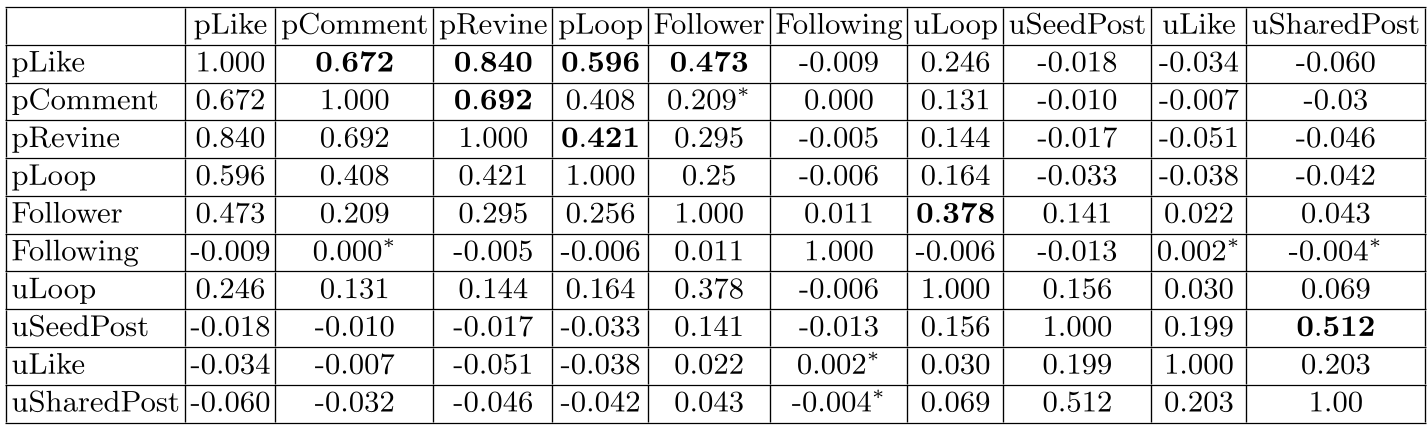 Table 3: Statistical correlations between likes, revines, and loops. Note the high correlation (0.84) between likes and revines.
The Dark Side: Cyberbullying's Reach
The final segment of the paper tackles a critical social issue: Cyberbullying. By comparing labeled cyberbullying videos with neutral ones, the authors found a "High-Engagement, Low-Diffusion" pattern:
- High Loops (Views): Cyberbullying videos often have higher loop counts and more comments. People watch the "train wreck."
- Low Revines: Users are significantly less likely to share bullying content. The mean revine count for bullying videos was ~720, compared to ~1095 for non-bullying videos.
- Isolation: Users who post bullying content tend to have fewer followers and follow fewer people, acting as active but isolated "seeders" of toxic content.
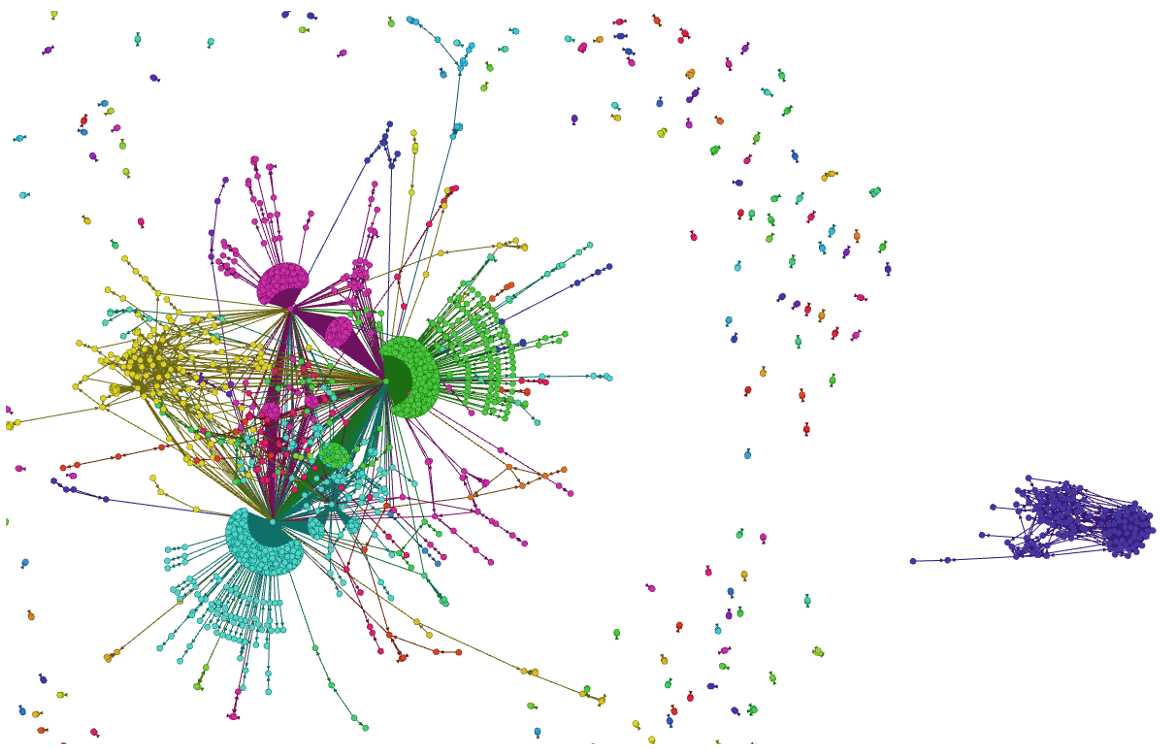 Figure 17: A Revine Tree demonstrating how secondary influencers (light blue/green nodes) can sometimes drive more propagation than the original poster.
Critical Insight & Conclusion
This paper highlights that "engagement" is not a monolith. High view counts (loops) can be a sign of morbid curiosity (in the case of cyberbullying), whereas deep network hops (revines) are the true measure of a video's cultural resonance. For developers of safety algorithms and recommendation engines, this suggests that the structural velocity and depth of a post are better indicators of healthy content than raw view counts.
The study’s limitation lies in its age—the Vine network is no longer active—but the behavioral insights into short-form video are arguably more relevant today than ever in the era of TikTok and YouTube Shorts.