
Deciphering the Blueprint of Power: A Complex Network Analysis of the U.S. Electricity Market
Applied Mathematics and Computation
The paper introduces a complex network approach using Visibility Graphs (VG) and multilayer network theory to analyze the structural properties of the U.S. regional electricity market. By integrating time-series data of electricity prices, renewable energy proportions, GDP, and CO2 emissions from 1990 to 2014, the study achieves a robust multi-dimensional classification of state-level energy policies, identifying four distinct regional clusters.
TL;DR
Researchers have mapped 25 years of U.S. electricity data into "Visibility Graphs," transforming abstract time series into a complex multilayer network. The result? A definitive classification of the American energy landscape into four structural communities, revealing how state-level policies on CO2, prices, and renewables actually align with the physical reality of the grid.
Context: A Fragmented Giant
Unlike many nations with a unified national grid, the U.S. power system is a patchwork of state-level regulations and three major regional interconnections (Eastern, Western, and Texas). Understanding the "pulse" of this system requires more than just looking at averages; it requires looking at the topology of how economic and environmental factors evolve together.
Methodology: From Time Series to Topology
The core innovation of this paper lies in the Visibility Graph (VG) method.
1. The Visibility Logic
Imagine a time series as a mountain range. Two points in time "see" each other if there is a straight line of sight between them that isn't obstructed by a taller peak (a higher data point) in between. By connecting these visible points, a time series is transformed into a network.
- Why it works: This method inherits the nonlinear dynamics and fractal properties of the original signal, allowing researchers to apply Graph Theory to temporal data.
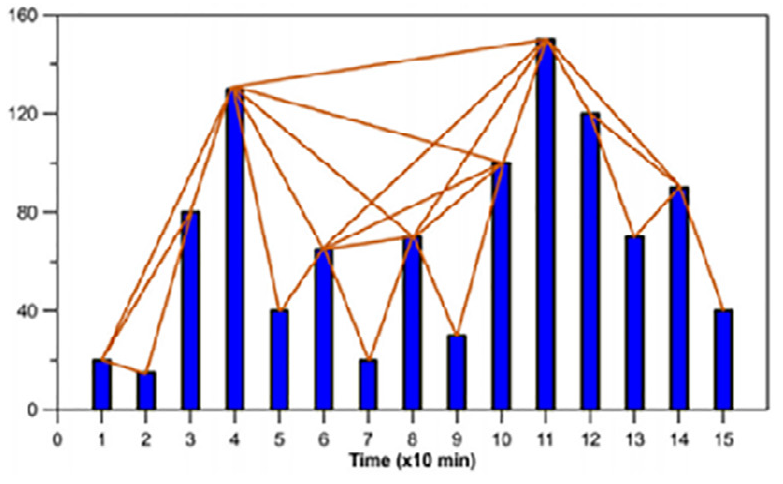 Figure 1: The conversion process from a raw time series to a visibility network.
2. The Multilayer Coupling
The authors didn't just look at one metric. They analyzed four:
- GDP per capita (Economic driver)
- CO2 Emission Rate (Environmental constraint)
- Electricity Price (Market outcome)
- Renewable Energy Ratio (Policy shift)
These were combined into a Multilayer Network. Each state is a node, and the "edges" between them represent the similarity in how these four metrics evolved over 25 years.
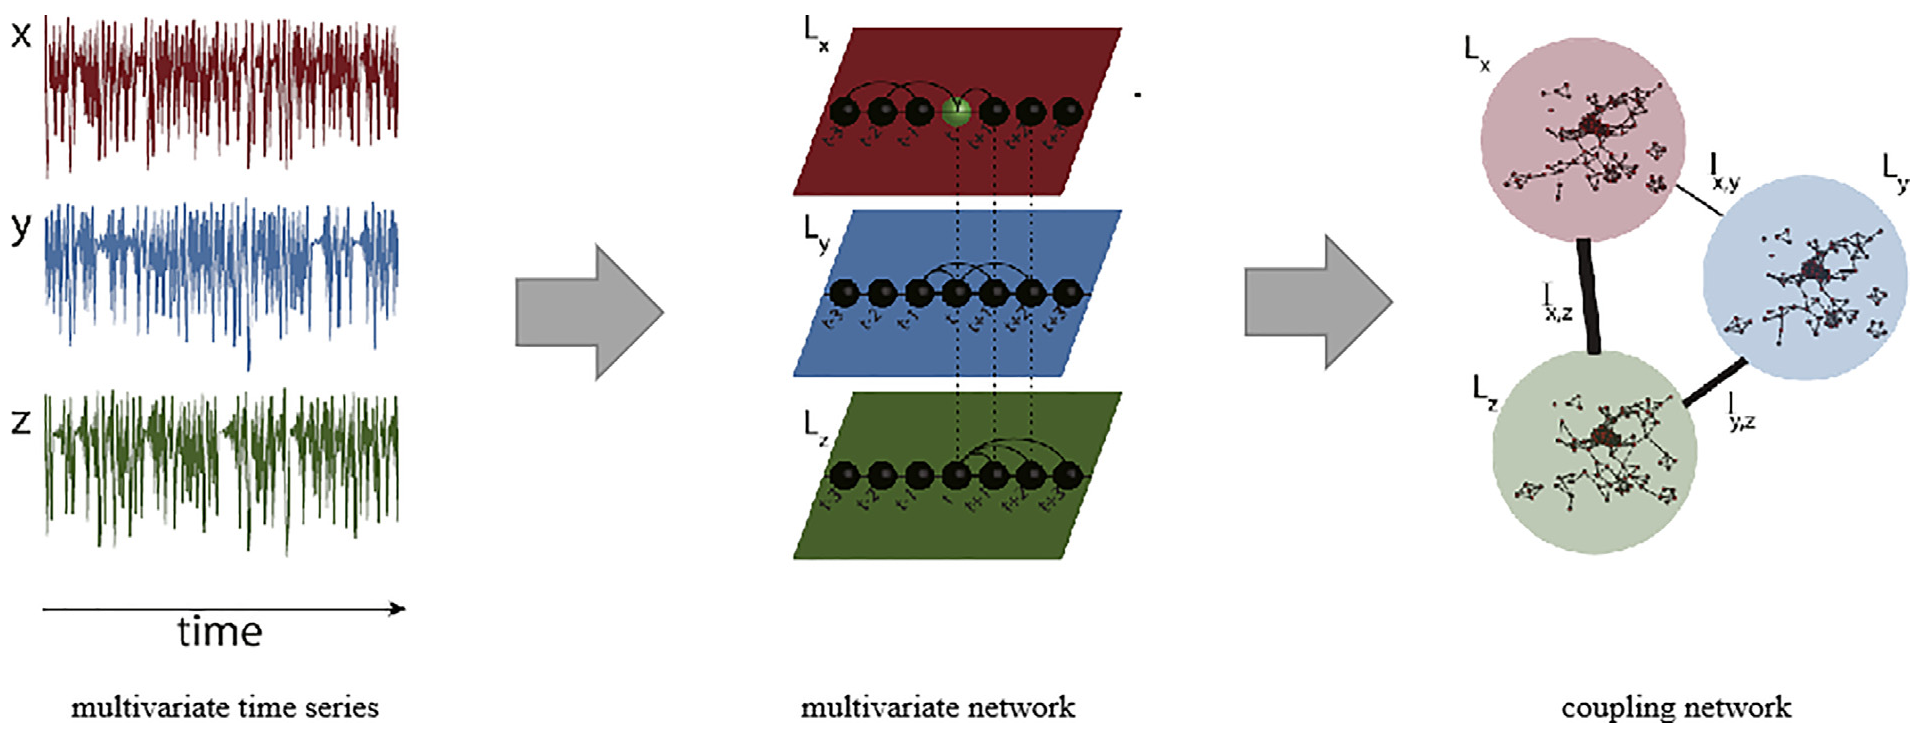 Figure 2: Workflow of coupling individual indicator networks into a composite regional similarity network.
Key Insights: The Four Power Tribes
By applying community detection (specifically maximizing the modularity function), the study identified that the U.S. essentially operates as four distinct "policy tribes":
- Western System: Dominated by California's aggressive renewable goals.
- Texas (ERCOT): A unique, highly independent energy island.
- Middle-Northern Cluster: Focused on industrial stability.
- Eastern System: Complex, high-density market integration.
The study found that Electricity Prices showed the highest variance across states, suggesting that while CO2 and GDP trends might be national, the market for power remains stubbornly local.
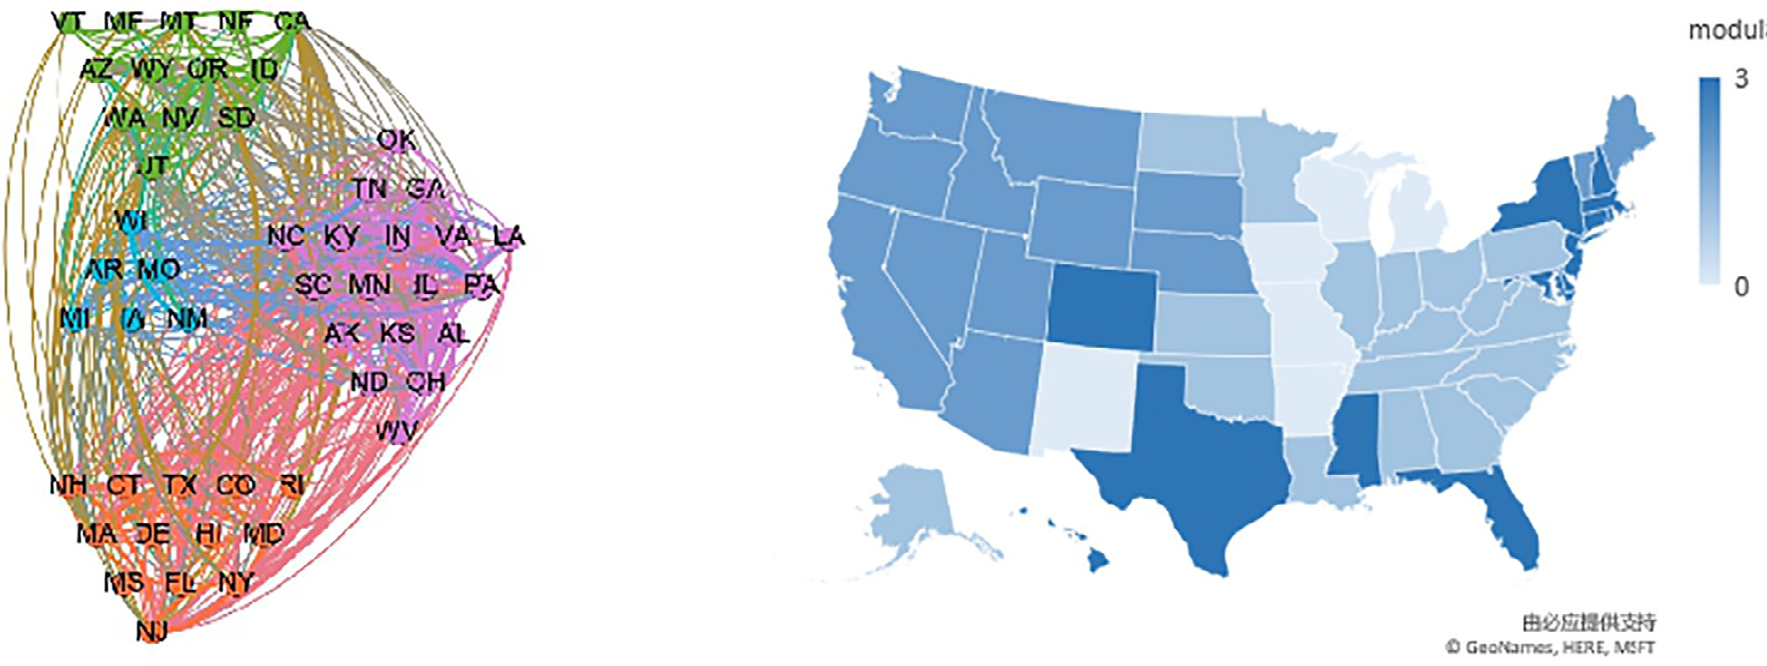 Figure 3: The identified four communities mapped onto the U.S. geography, showing clear regional clustering.
Critical Analysis & Conclusion
Why this matters
The use of Visibility Graphs bypasses the limitations of traditional correlation coefficients (like Pearson), which often fail if the data is non-stationary or has heavy tails. By treating the U.S. energy market as a Complex System, the authors prove that regional agglomeration is not just a geographical accident—it's a structural necessity for market stability.
Strategic Takeaway
For policymakers, this implies that a "one-size-fits-all" national carbon policy might fail. Instead, policies should be tailored to the four "communities" identified here, as states within these clusters already exhibit highly synchronized responses to market shifts.
Future Outlook
While this study covers up to 2014, the next frontier is applying this to the "Post-Paris Agreement" era (2015-2025). As decentralized "Micro-grids" and EV integration increase, the complexity of these networks will likely shift from a state-to-state level to a city-to-city level.