
Stripping the Noise: Identifying Social Network Influencers through Activity Stratification
Approach to Identification and Analysis of Information Sources in Social Networks
The paper introduces a stratified approach for identifying and analyzing communicative leaders within online social networks (OSNs). By focusing on user activity levels (specifically comments) rather than complex link analysis or NLP, the method successfully isolates "E-fluentials"—a core group representing less than 1% of the audience—who drive social discourse.
TL;DR
In the battle against misinformation and bots, researchers often drown in data. This paper proposes a "less is more" strategy: by segmenting audiences based on their communication frequency and focusing on the top <1% of "E-fluentials," we can evaluate entire social communities without the need for expensive text mining or complex graph clustering.
The Scalability Wall in Social Network Analysis
Modern Social Network Analysis (SNA) faces a paradox: as social platforms grow, our ability to monitor them in real-time shrinks. Typical approaches to identifying "bad actors" or fake news distribution channels involve:
- Text Analysis: Computationally expensive and language-dependent.
- Link/Graph Analysis: Hard to scale and increasingly limited by platform API restrictions.
The authors argue that we don't need to see the whole forest to understand its health; we only need to look at the tallest trees—the communicative leaders.
Methodology: The Communicative Kernel
The core innovation is a hierarchical segmentation algorithm. Instead of treating all "likes" and "comments" equally, the authors define a Communicative Kernel based on meaningful interactions (posting comments).
The 6-Level Hierarchy
Users are filtered through several "average value" gates to be placed into one of six categories:
- E-fluentials: The ultimate leaders driving the narrative.
- Sub-Efluentials: Close followers and secondary amplifiers.
- Activist: Highly active participants.
- Sub-Activist: Occasional contributors.
- Observer: Users who read but rarely speak.
- Passive: The "silent majority" who never interact.

The beauty of this method lies in its simplicity. By calculating the average activity and cutting off those below it iteratively, the system naturally isolates the most influential nodes.
Experimental Results: The 1% Rule
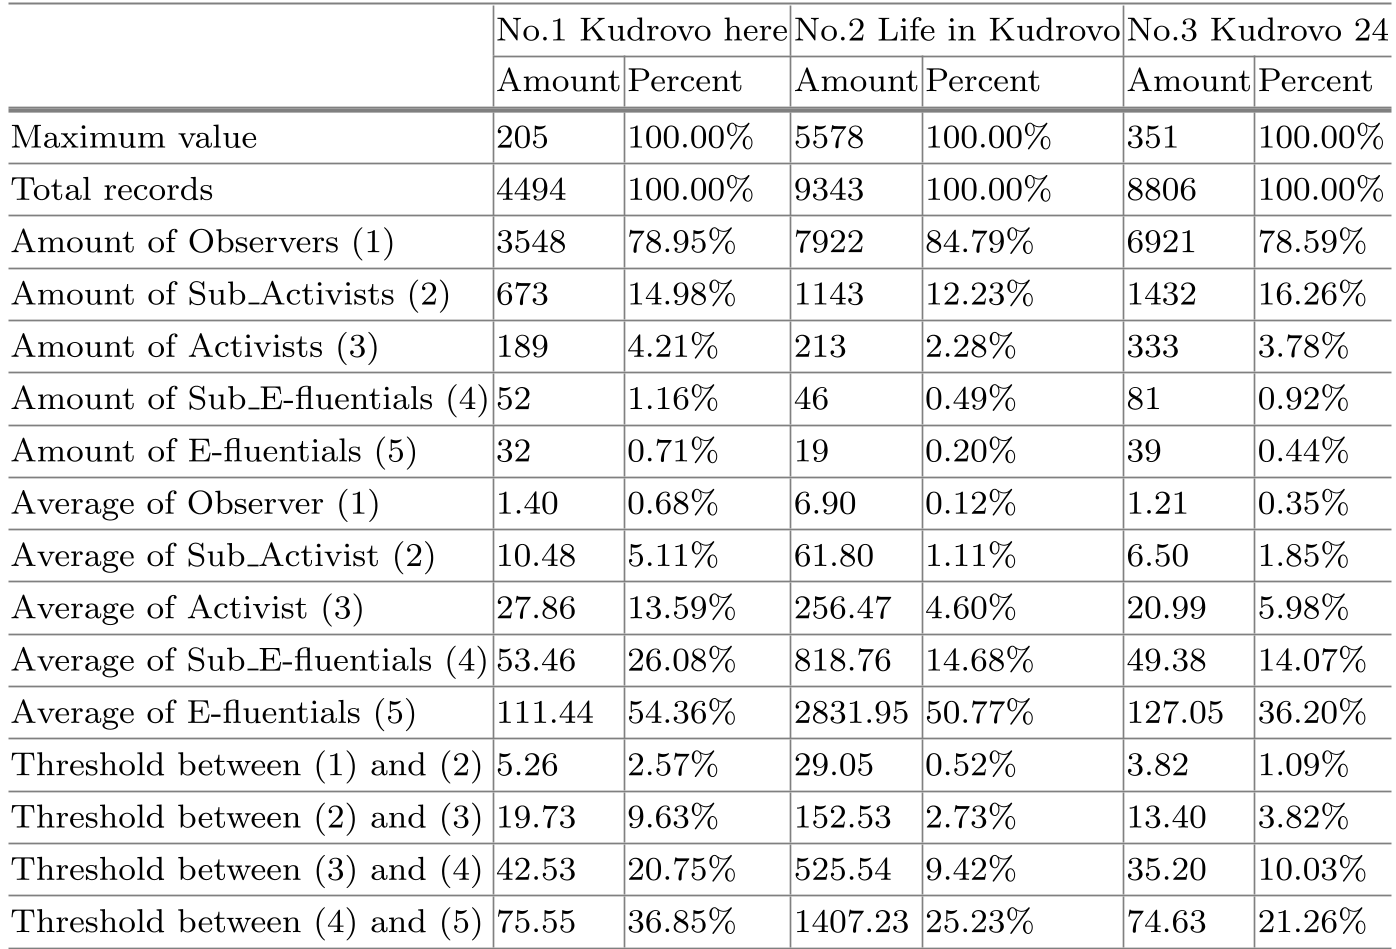
The researchers tested their hypothesis on three massive communities in the Russian social network VKontakte, focusing on the city of Kudrovo.
Key Findings:
- Activity vs. Size: The group "Life in Kudrovo" was the smallest in terms of members but 1000x more active than its larger counterparts.
- Data Reduction: In all cases, "E-fluentials" made up less than 1% of the total audience.
- Open Profiles: Most communicative leaders maintain open profiles, making them accessible for deeper behavioral analysis without violating privacy constraints or needing special API permissions.
Critical Insights
The method provides a robust shortcut for Human-in-the-Loop security systems. Instead of an operator checking thousands of accounts for bot-like behavior, they only need to analyze the ~20-40 "E-fluentials" identified by the algorithm.
Why this works? Information warfare and marketing campaigns rely on "hubs." If you control the hub (the E-fluential), you control the diffusion. By isolating these hubs, we can identify "fake liker" clusters and abnormal activity (like 24/7 commenting) that signals automated interference.
Conclusion & Future Outlook
This paper shifts the focus from "Big Data" to "Smart Data." While the study was limited to VKontakte and used manual segmentation for the experiment, it lays the groundwork for automated, low-resource monitoring tools.
Future research will likely explore how these "E-fluentials" behave across different platforms (e.g., cross-posting between Twitter and Telegram) and how their "discrete features" (like the exact timestamp of their posts) can be used to mathematically prove a profile is a bot.
Main Takeaway: In social networks, the noise is loud, but the influence is concentrated. Find the 1%, and you find the source.