
Decoding Digital Dependency: Linking API-Based Behavior to SNS Addiction
Assessing Symptoms of Excessive SNS Usage Based on User Behavior and Emotion Analysis of Data Obtained by SNS APIs
The paper presents a methodology to assess symptoms of excessive Social Networking Site (SNS) usage by combining self-reported questionnaire data with objective behavioral data retrieved via Facebook and Twitter APIs. The study utilizes modified versions of the Internet Addiction Test (IAT) and the Bergen Facebook Addiction Scale (BFAS) to identify key behavioral predictors of SNS addiction among Thai undergraduate students.
TL;DR
Researchers have moved beyond simple surveys to track the "digital footprints" of social media addiction. By extracting real-time data from Facebook and Twitter APIs, this study identifies that when you post (late-night) and how you interact (high reply/comment frequency) are more telling of addiction than just how many friends you have or how many photos you upload.
Contextual Positioning
This work acts as a bridge between traditional psychological assessment and modern data science. While behavioral addiction scales like IAT and BFAS are industry standards, this paper attempts to ground these mental health metrics in hard, immutable data points—specifically, timestamped events from SNS APIs.
The Problem: The Subjectivity Gap
Why do we need APIs to tell us someone is addicted? Traditional research relies on participants' memory ("How many hours do you think you spent on Facebook last week?"). Human recall is notoriously poor, especially for habitual or compulsive behaviors. Existing work often fails to distinguish between different platforms; as this paper demonstrates, a "Twitter addict" looks very different from a "Facebook addict."
Methodology: High-Fidelity Tracking
The core of this research is a custom application that segments user activity into "sessions." If a user stops interacting for more than 30 minutes, the session is considered closed. This allows for a precise calculation of Length of Use and Frequency of Use.
System Architecture and Metrics
The researchers used two primary channels for data:
- Subjective: Thai versions of the Internet Addiction Test (IAT) and Bergen Facebook Addiction Scale (BFAS).
- Objective: Direct data pulls including video shares, status updates, comments, and replies.
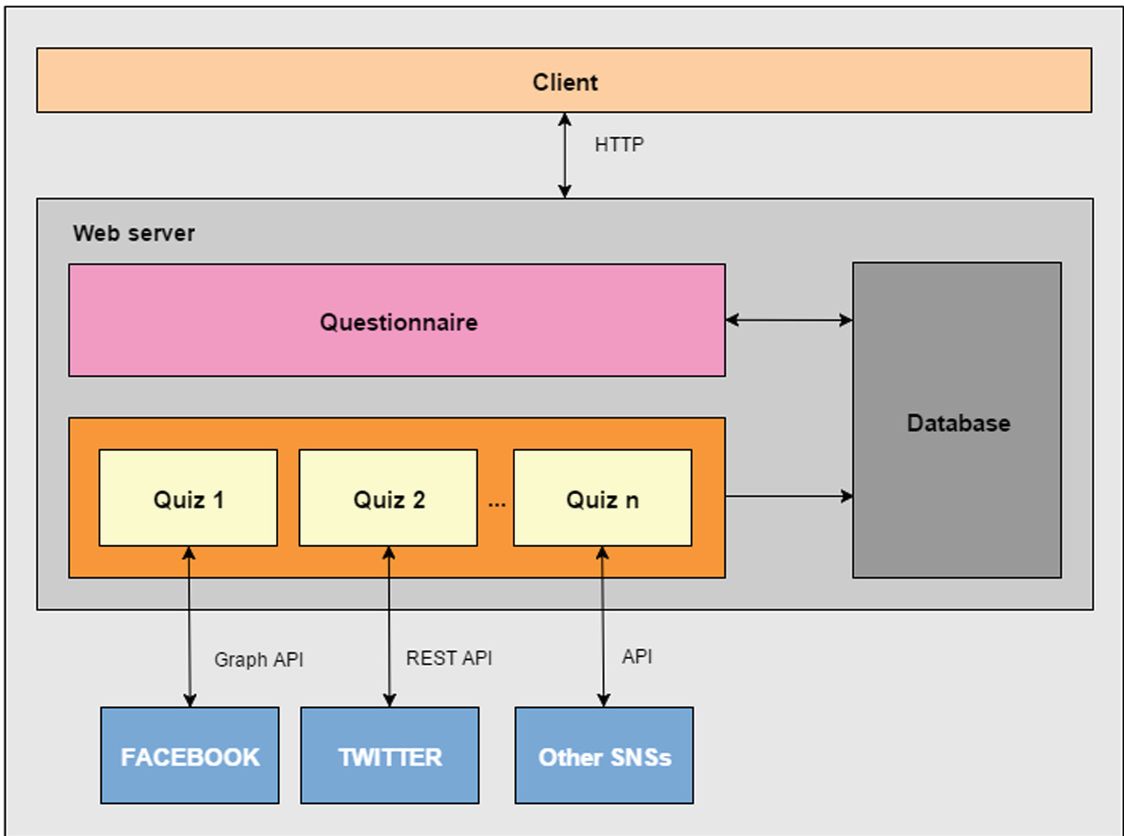 Figure 1: The data collection flow linking user authorization via OAuth to the API retrieval system.
Experimental Insights: Facebook vs. Twitter
The study found fundamental differences in how "excessive use" manifests across platforms:
- Facebook: Addict behavior is characterized by high interactivity (commenting and replying) and peak usage during the 18:00–24:00 window.
- Twitter: Usage is more dispersed but notably higher after midnight for those scoring high on addiction scales. Unlike Facebook, Twitter usage is driven more by content sharing (retweets) than simple responding.
Predicting Addiction
Through logistic regression, the authors determined that interaction counts (comments/replies) and late-night usage ratios could distinguish excessive users with nearly 70% accuracy.
 Table 1: The Session Identification logic used to convert raw API timestamps into meaningful 'usage events'.
Critical Analysis & Conclusion
The "Passive" Limitation: One major hurdle noted by the authors is that APIs do not capture "lurking" (scrolling without interacting). Therefore, the "time spent" recorded via APIs may actually be an underestimation of total screen time.
Future Outlook: The research underscores a shift toward Web Log Analysis. As social media companies increasingly restrict API access (the "API Cordon"), researchers will likely turn to browser extensions or OS-level tracking to capture the full spectrum of digital behavior.
Key Takeaway: If you find your social media activity peaking after midnight and moving from "passive browsing" to "compulsive replying," you may be exhibiting the core biological and psychological markers of SNS addiction identified in this study.