
Beyond Unique Visitors: Decoding Online Civic Engagement through Network Analytics
Assessing Online Community-Building through Assortativity, Density and Centralization in Social Networks
The paper investigates community capacity building in a 10-year longitudinal study of an Australian e-government forum (NSW Community Builders). It employs Social Network Analysis (SNA) metrics—specifically assortativity, density, and centralization—to measure the evolution of civic engagement and social capital in an online environment.
TL;DR
Is an e-government forum successful just because people click on it? This 10-year longitudinal study argues "No." By analyzing the NSW Community Builders forum using Social Network Analysis (SNA), the researchers found that while the platform succeeded in becoming decentralized (less hierarchical), it failed to become denser or foster assortative clusters over time. The study reveals a hard truth: technology alone doesn't build communities; social dynamics do.
The "Why": Moving Past Vanity Metrics
In the early 2000s, government agencies viewed online forums as the "digital town square." Success was measured by hits and visitors. However, the authors posit that these metrics are blind to Social Capital—the "glue" of trust and norms that makes a society function.
The core motivation of this study was to see if an Online Social Network (OSN) could mirror the healthy social structures described by Putnam (1995): dense, egalitarian, and self-sustaining. The authors hypothesized that as a community matures, it should become:
- Denser: More people talking to each other.
- Decentralized: Communication flowing citizen-to-citizen (C2C) rather than just government-to-citizen (G2C).
- Assortative: Like-minded or similarly active individuals finding each other.
The Methodology: SNA as a Lens
The researchers didn't just look at what was said, but who was talking to whom. They analyzed 1,450 messages across 2,036 actors over a decade.
Key Metrics Defined:
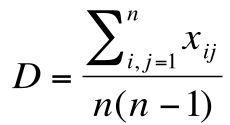
- Density: The ratio of actual connections to possible ones. High density = high cohesion.
- Centralization: Does one person (e.g., a moderator) dominate the room?
- Assortativity: The tendency for "highly active" people to talk to other "highly active" people.
Insights from the Data: A Mixed Reality
The results from the longitudinal analysis (2001-2010) show a complex picture:
1. The Myth of the "Growing" Community (Density)
Surprisingly, the network density did not increase significantly over time. It remained sparse (Mean = 0.0042). This suggests that while more people joined, they didn't necessarily form a tight-knit web. Instead, the network behaved more like a collection of "latent ties" that were rarely activated.
2. The Success of Democracy (Centralization)
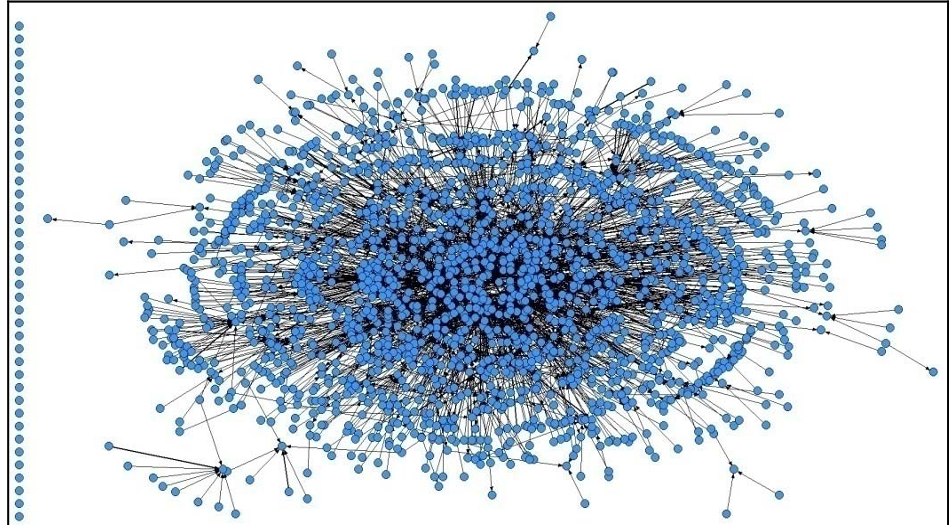
If there is a "win" for the government here, it’s in Decentralization. The centralization index dropped from 0.17 to 0.08.
Physical Insight: The network became a flatter, non-bureaucratic space. It wasn't just a government official broadcasting to the masses; the "center" of the conversation began to dissipate, as visualized in the sociogram below.
3. The Assortativity Trend
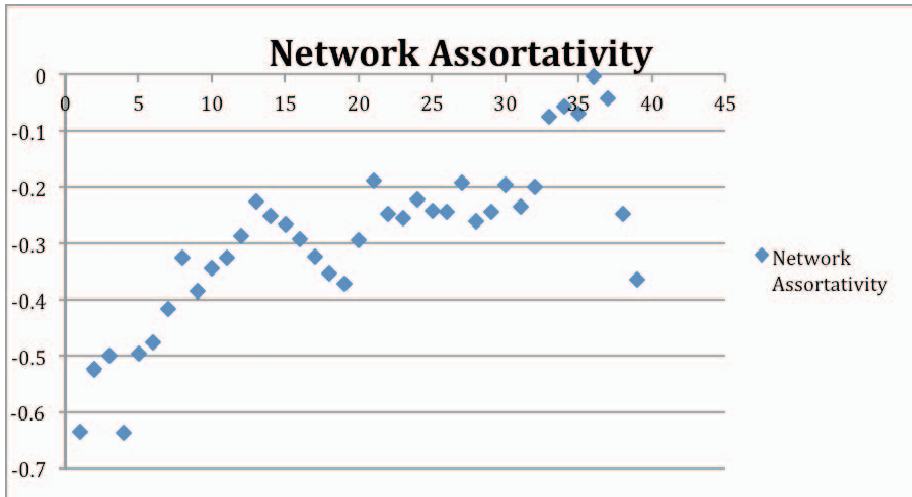
The authors used a 6-month sliding window analysis to track the "mood" of the network. They found that in the early years (2001-2004), the network was strongly disassortative (high-activity actors talking primarily to low-activity actors), but this trend started to decline.
Deep Insight: Why Did Density Stall?
The interview with the project manager provided a crucial "human" explanation for the stagnant density. By 2004, the internet changed.
- The Competitor Effect: Platforms like Facebook and Twitter began to "steal" the social energy of participants.
- Information Accessibility: In 2001, you asked a forum because you couldn't find the info. In 2010, you simply Googled it. Relational sources were replaced by non-relational repositories.
Critical Analysis & Conclusion
This paper serves as a cautionary tale for "Digital Transformation" in the public sector.
The Takeaway:
- Infrastructure != Community: You can build the platform, but you cannot mandate the "social capital."
- Metric Overhaul: Governments must stop reporting "page views" as success. They should monitor centralization to ensure they aren't creating new digital bureaucracies.
Limitations: The study focuses on the structure of ties but misses the content (sentiment/topic). A decentralized network might be flat, but is the conversation actually productive? Future work combining SNA with NLP (Natural Language Processing) is the logical next step for this field.