
Digital Red Flags: Decoding SNS Addiction Through Web Logs and Behavioral Timing
Assessing Symptoms of Excessive SNS Usage Based on User Behavior and Emotion: Analysis of Log Data
The paper presents a framework for assessing excessive Social Networking Site (SNS) usage by analyzing web log data and psychological questionnaires (IAT and BFAS). Utilizing data from 177 university students in Thailand, the researchers identified specific behavioral patterns, such as morning usage (09:00-12:00), that distinguish excessive users from normal users.
TL;DR
Researchers have moved beyond simple surveys to track the "digital footprints" of social media addiction. By merging campus web logs with clinical surveys (IAT/BFAS), this study discovers that when you use social media (specifically between 09:00 and 12:00) is a more significant indicator of excessive usage than simply how long you stay online.
Background: The Shift from Subjective to Objective Data
Social Networking Site (SNS) addiction is increasingly categorized alongside traditional behavioral addictions. However, most research has been limited by self-reporting: users often underestimate their online time. This study bridges the gap by analyzing raw web log data—the actual records of network requests—to provide an objective lens on user behavior.
The "Morning Trap": Why Timing Matters
The research posits that excessive SNS usage isn't just about total volume; it's about the invasion of social media into critical life domains. By analyzing usage across different time blocks, the authors found a striking correlation between addiction scores and morning usage.
1. Methodology: From Raw Logs to "Sessions"
To make sense of thousands of lines of raw server logs, the authors applied Session Identification. Following empirical standards, they defined a session as a sequence of activities with no more than a 30-minute gap.
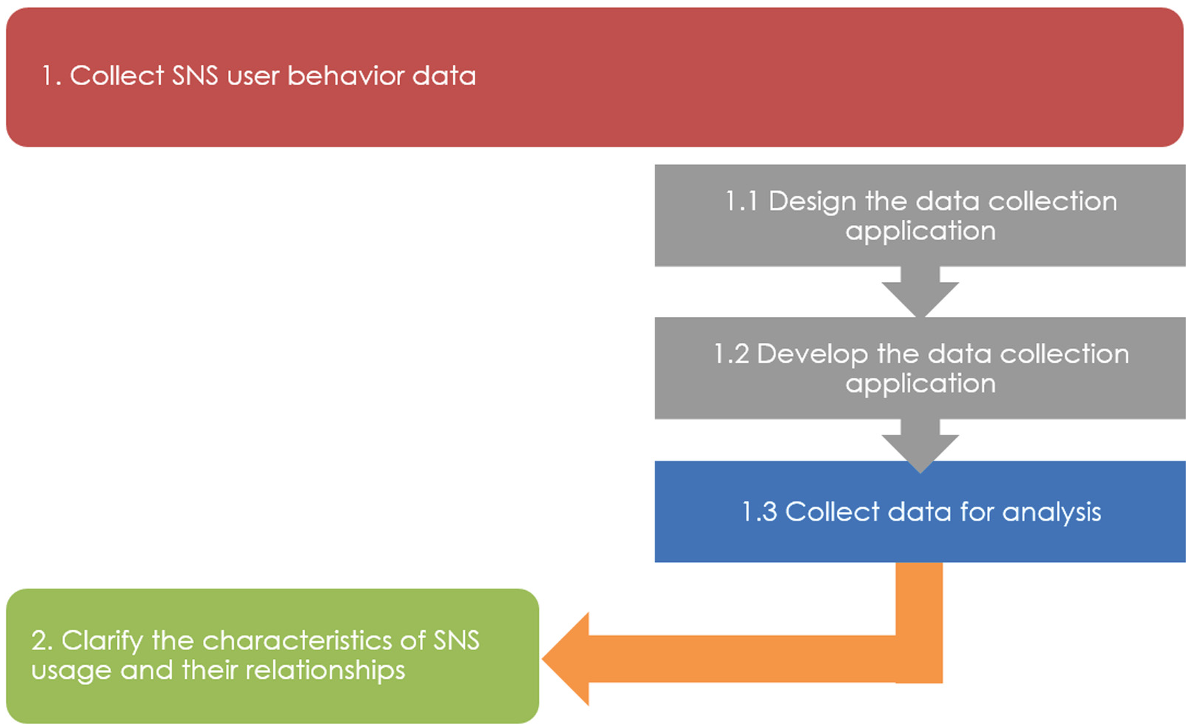 Figure 1: The multi-stage data collection process involving questionnaires, APIs, and web logs.
2. Behavioral Patterns: Facebook vs. Twitter
The study highlights an interesting divergence in Thai student behavior:
- Twitter was the dominant platform for specific heavy users (accounting for 65% of their SNS time).
- Facebook remained the generalist leader (about 2 hours per user globally in the sample).
- Normalization: The highest density of sessions occurred during the lunch hour (12:00-13:00), but this was deemed "normal" behavior.
Critical Findings: Identifying the Excessive User
The core of the paper lies in the Mann-Whitney U Test results, which compared normal and excessive users (as categorized by the Bergen Facebook Addiction Scale and IAT).
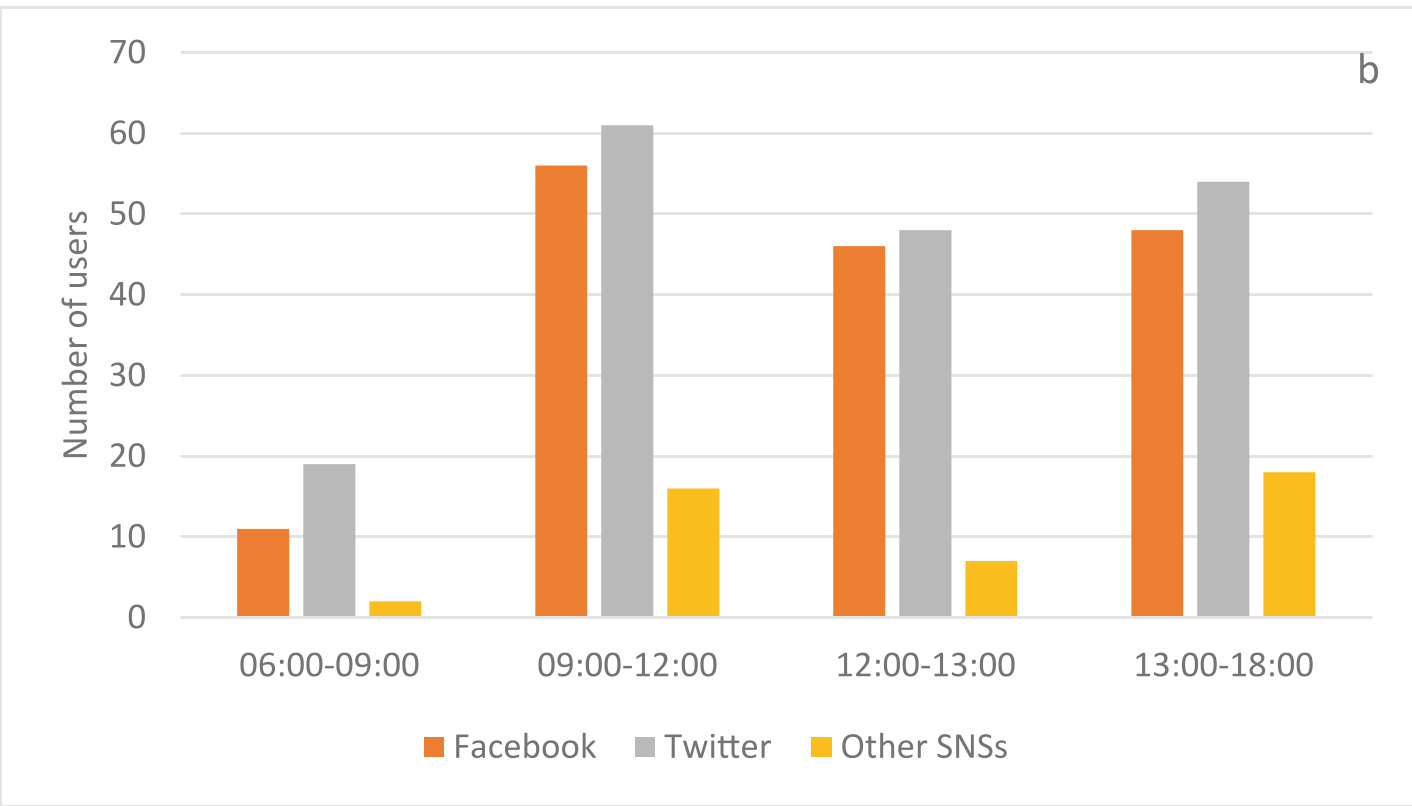 Figure 2: Normalization of sessions across time periods. Peak usage occurs at noon, but morning usage is the differentiator.
| Variable (09:00–12:00) | IAT (Z-value) | BFAS (Z-value) |
|---|---|---|
| All SNSs | -2.038* | -3.105* |
| -0.782 | -2.526* | |
| -2.123* | -3.341* | |
| (Significant at 0.05 level) |
The statistical significance of the 09:00–12:00 window suggests that excessive users struggle with "Salience" and "Conflict"—they are unable to resist SNS usage during primary lecture or work hours, a hallmark of behavioral addiction.
Insights & Future Outlook
The study’s most profound insight is the validation of the biopsychosocial addiction model through raw data. Specifically, "Tolerance" (spending more time) and "Mood Modification" (using SNS to change emotional states) are reflected in the high frequency of sessions during hours when a user should be otherwise engaged.
Limitations and Next Steps
- The LAN Barrier: The data only captured LAN/WiFi usage within the university, missing mobile 4G/5G data which likely accounts for a significant portion of student activity.
- Biological Integration: The authors hint at a future stage involving biological signals (heart rate, skin conductance) to estimate real-time emotion during SNS usage, which could eventually lead to "Auto-Intervention" apps that detect stress-driven scrolling.
Conclusion
This research provides a roadmap for "Digital Health" features. Rather than just setting a daily timer, future tools should perhaps alert users when they fall into "risky timing" patterns, like compulsive checking during morning hours, which this study identifies as a primary symptom of SNS addiction.