
Beyond Accuracy: A Formal Method for Stress-Testing Healthcare Predictive Models
Assessment of temporal predictive models for health care using a formal method
The paper introduces a formalized evaluation framework for multi-objective temporal mathematical models in healthcare, specifically targeting high-frequency sensor data. It employs a suite of metrics—descriptive and predictive capability, parameter sensitivity, and model complexity—and validates the method through a case study on depression-related mood models.
TL;DR
As wearable sensors provide a flood of fine-grained health data, we are seeing a shift from "black-box" AI to mathematical models that describe biological dynamics. However, these models are often poorly validated. This paper proposes a formalized assessment framework that evaluates mathematical models across four dimensions: Descriptive Capability, Predictive Capability, Parameter Sensitivity, and Complexity. Testing it on depression models revealed a sobering truth: theoretically "superior" models often struggle to beat naive baselines when subjected to rigorous empirical scrutiny.
The "Insight" Gap in Health Modeling
In healthcare, we don't just want to know if a patient will relapse; we want to understand why. Mathematical models (using differential equations) are ideal for this because they translate verbal hypotheses into precise mechanics.
The problem? Most of these models are evaluated on "looks like" data. They might simulate a generic mood swing well, but they aren't held to the same standards as machine learning:
- Failure to Generalize: Models are "fit" to training data but fail on test data.
- Parameter Bloat: Researchers add parameters without checking if they actually contribute or if they are just correlated (collinearity).
- Ignoring Trade-offs: Real health involves multiple objectives (e.g., mood and physical activity). Optimization must account for the trade-offs between them.
Methodology: The Four Pillars of Model Validity
The authors argue that a model's "Performance Score" shouldn't be a single number. Instead, it’s a composite of four criteria:
- Descriptive Capability: Using NSGA-II (a Genetic Algorithm), the method finds a "Pareto Front" of solutions where you can't improve the prediction of one health state without hurting another. The area (Hypervolume) under this front indicates how well the model can fit the data.
- Predictive Capability: This measures absolute error on unseen data and the correlation between training and test performance. If a model performs great on training but poorly on testing, the correlation is low, signalling overfitting.
- Parameter Sensitivity: Does every parameter earn its keep? The method checks if changes in a parameter actually impact the error and ensures parameters aren't so highly correlated (collinearity) that they make the model unstable.
- Complexity: Inspired by "Parsimony Pressure," this penalizes unnecessarily complex models with too many internal states.
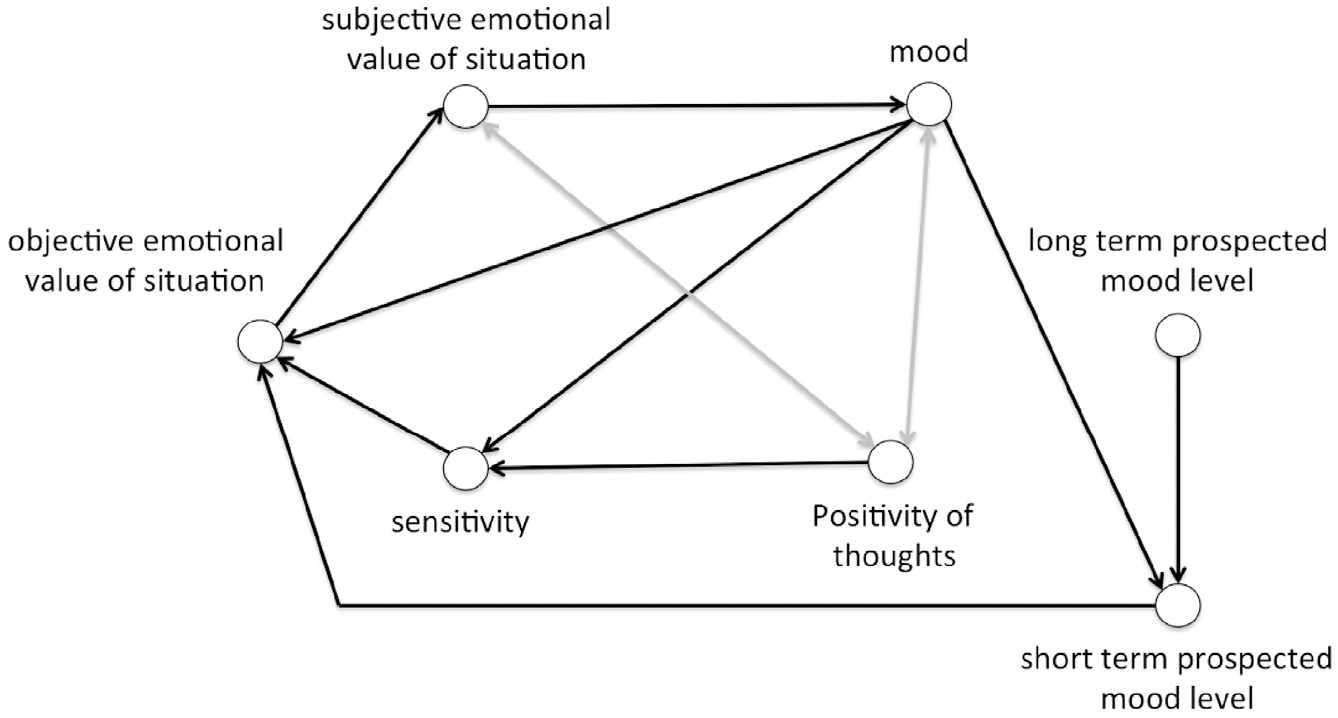 Figure 1: The complex "Literature Model" analyzed in the study, featuring internal states like Positivity of Thoughts and Emotional Sensitivity.
Case Study: Literature vs. Naive Models
The researchers compared a 9-state Literature Model (based on psychological theory) against a 2-state Naive Model.
Key Findings:
- The Theory Paradox: The Literature Model was technically better at fitting the training data (Descriptive Score: 0.905 vs 0.854), but it didn't drastically outperform the Naive model in actual prediction.
- Hidden Instability: The formal check found a collinearity issue () in the Literature model's parameters. This lack of "stability" explains why it struggled to generalize to new patients.
- Complexity Penalty: The Literature model received a complexity score of 0 (the highest possible penalty) because it was the most complex model in the set without providing a proportional jump in accuracy.
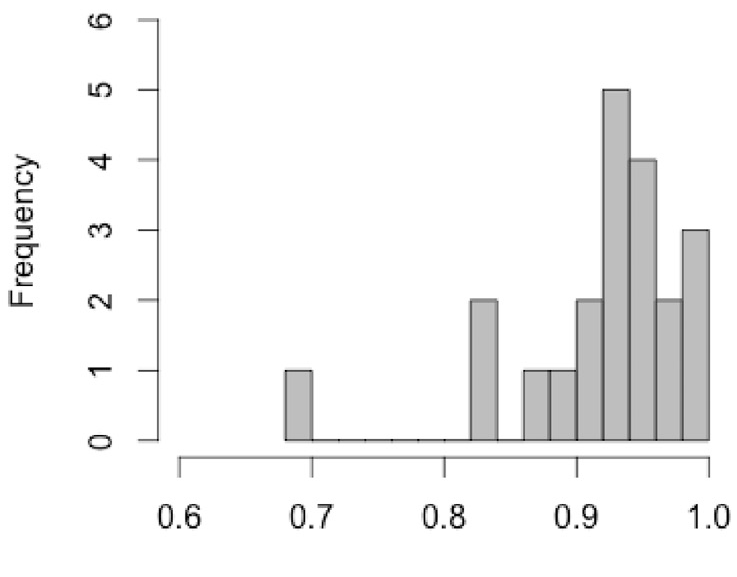 Figure 2: Distribution of non-dominated hypervolume across patients. While the Literature model (left) is more consistent, the Naive model (right) shows higher variance in descriptive quality.
Critical Analysis & Conclusion
The true value of this paper isn't the depression model itself, but the disciplinary rigor it demands. By forcing models through a MOO (Multi-Objective Optimization) pipeline, we can see exactly where a "theoretically sound" model breaks down in the real world.
Limitations:
- The sample size (21 patients) is small, limiting the statistical weight of the predictive correlations.
- The "Complexity" metric is relative to the models studied; a more universal measure of structural complexity would be a valuable addition.
Takeaway for Practitioners: If you are building predictive systems for health, "fitting the curve" is the bare minimum. Use sensitivity analysis to prune your parameters and multi-objective optimization to understand the trade-offs between different health metrics. A simpler, stable model is almost always better for clinical deployment than a complex, theoretically elegant one that overfits.