
Gestaltmatrix: Visualizing the "Seesaw" of Evolving Social Relationships
Asymmetric Relations in Longitudinal Social Networks
The paper introduces Gestaltlines and the Gestaltmatrix, a novel visualization framework for longitudinal asymmetric social networks. By combining Tufte's sparklines with gestalt-theory-based glyphs in a matrix format, it provides a static, data-rich alternative to traditional animations for exploring evolving dyadic relations.
TL;DR
Social networks are rarely static, yet our tools for visualizing their evolution—primarily animations—often obscure the very patterns they aim to show. This paper introduces the Gestaltmatrix, a static, high-density visualization that uses "seesaw" glyphs to represent the balance and strength of relationships over time. It allows researchers to see the entire history of a network in a single, printable image, revealing hidden dynamics in classic datasets like the Newcomb Fraternity study.
The Problem: The Cognitive Load of Animation
In longitudinal social network analysis, researchers track how "Actor A" feels about "Actor B" over multiple "waves" of observation. Traditional methods fall into two traps:
- Node-Link Animations: Nodes jump around to preserve layout stability, making it nearly impossible to track specific dyadic changes.
- Small Multiples: Printing 15 different versions of the same network side-by-side leads to "eye-straining" comparisons where subtle trends are lost.
The authors argue that we need a way to see the entire temporal trajectory of every pair (dyad) simultaneously without moving our eyes across different diagrams.
Methodology: The "Seesaw" Intuition
The core innovation is the Gestaltline. Inspired by Edward Tufte's sparklines and Gestalt psychology, the authors designed a glyph that functions like a mechanical scale:
- The Metaphor: A transparent tube pivoted in the middle. If Actor A likes B more than vice versa, the "tube" tilts toward A.
- Visual Encoding: The amount of ink (fill) represents the total intensity of the relationship, while the angle (slope) represents the level of reciprocity (or lack thereof).
- Time as Growth: These glyphs are stacked vertically (bottom-to-top), creating a "letter-like" word that depicts the history of a relationship.
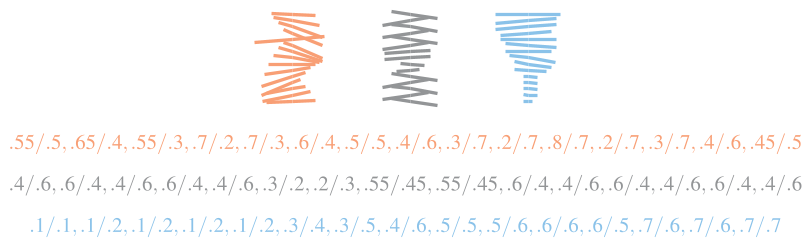 Fig 1: Decoding the Gestaltline. The slope instantly communicates who holds more power/influence in the dyad.
By arranging these glyphs into a matrix, the authors create a Gestaltmatrix. Rows represent an actor's outgoing choices (Ego), and columns represent the choices made by others toward them (Alter).
Case Study: Re-evaluating the Newcomb Fraternity Data
The authors applied this to the famous Newcomb Fraternity dataset—a study of 17 students over 15 weeks. While previous researchers used summary statistics, the Gestaltmatrix allows us to see the "messy" reality.
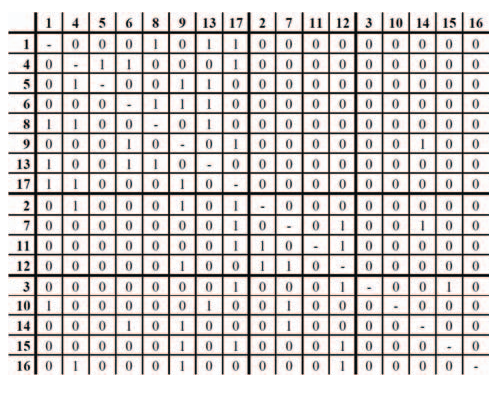 Fig 2: The full evolution of 4,080 rankings. Notice the dense blocks along the diagonal, indicating stable, tightly-knit sub-groups.
Key Insight: The visualization revealed that even the most "unpopular" members (like Actor 10, the "scapegoat") were initially overrated by the most popular members before being systematically ostracized. This nuance is often smoothed over in aggregate models but is glaringly obvious when looking at the persistent "tilts" in the matrix.
Critical Analysis & Conclusion
Why it Works
The Gestaltmatrix succeeds because it capitalizes on the Law of Common Fate. When you look at a row, your brain naturally groups glyphs with similar slopes, allowing you to quickly spot an actor who consistently targets popular peers or one who is universally ignored.
Limitations
- Path Discovery: Like all matrix representations, it is terrible for finding "the friend of a friend" (transitive links). You cannot track "paths" through the network easily.
- Scalability: While excellent for 10-100 actors, a network of 1,000 actors would require a poster-sized printout or hierarchical zoom levels.
The Future of Network Viz
This paper shifts the paradigm from representation (showing the data) to exploration (finding the story). By encoding temporal dynamics into a single static glyph, the Gestaltmatrix provides a "fingerprint" of social behavior that is far more analytical than a moving dots animation. For the modeling community, this is a vital tool for identifying "exceptional" actors who don't fit the homogeneity assumptions of current stochastic models.