
Deciphering the Skin's Pulse: High-Accuracy Emotion Mapping via Wavelet-Based EDA Analysis
Audio-video emotional response mapping based upon Electrodermal Activity
This paper proposes a machine learning framework for emotional pattern recognition using Electrodermal Activity (EDA) signals during audio-visual stimuli. By integrating discrete wavelet transform (DWT) features with model-based EDA decomposition and Multi-Layer Perceptron (MLPs), the authors achieve state-of-the-art results on the DEAP dataset: 79% accuracy for arousal, 69.8% for valence, and 71.2% for dominance.
TL;DR
This paper introduces a sophisticated machine learning pipeline for emotional response mapping using only Electrodermal Activity (EDA). By bypassing traditional time-domain limitations and moving toward Wavelet-domain features combined with Continuous Deconvolution Analysis, the researchers achieved a significant accuracy boost on the benchmark DEAP dataset (reaching up to 79% for arousal).
Background: Why the Skin Doesn't Lie
In affective computing, "state" factors like facial expressions can be easily concealed or faked. "Trait" factors, specifically psychophysiological signals controlled by the Autonomic Nervous System (ANS), provide a more honest window into a subject's internal state. Among these, EDA (or Galvanic Skin Response) is unique because it is purely driven by the sympathetic nervous system, making it an ideal candidate for measuring Arousal.
1. The Problem: The Limitations of "Peaks"
Most prior works attempted to map emotions by simply counting "peaks" in skin conductance. However, this method fails when:
- Stimuli overlap: If two emotional triggers occur close together, the skin's response doesn't return to baseline, causing "slope distortion."
- Subjectivity: Thresholds for defining a "peak" vary wildly between researchers.
- Information Loss: Time-domain features (like rise time or max amplitude) ignore the frequency-based "coarseness" and temporal distributions of the signal.
2. Methodology: From Decomposition to Wavelets
The authors addressed these challenges through a three-stage pipeline:
A. Model-Based Decomposition
Instead of simple filtering, they used Continuous Deconvolution Analysis (CDA) via the Ledalab toolbox. This treats the EDA signal as a convolution between Sudomotor Nerve Activity (SMNA) and an Impulse Response Function (IRF).
This allows the signal to be cleanly separated into Tonic (baseline) and Phasic (rapid response) components, even with overlapping stimuli.
B. The Power of the Wavelet Domain
The core technical "win" of this paper is the transition to the Wavelet Domain. Using Daubechies-3 (db3) mother wavelets, the signal was decomposed into 5 levels.
- Why Wavelets? Unlike Fourier Transforms, Wavelets provide joint time-frequency localization. They reveal "self-similarity patterns" in sweat gland activity that capture the nuance of emotional fluctuations during a 60-second music video.
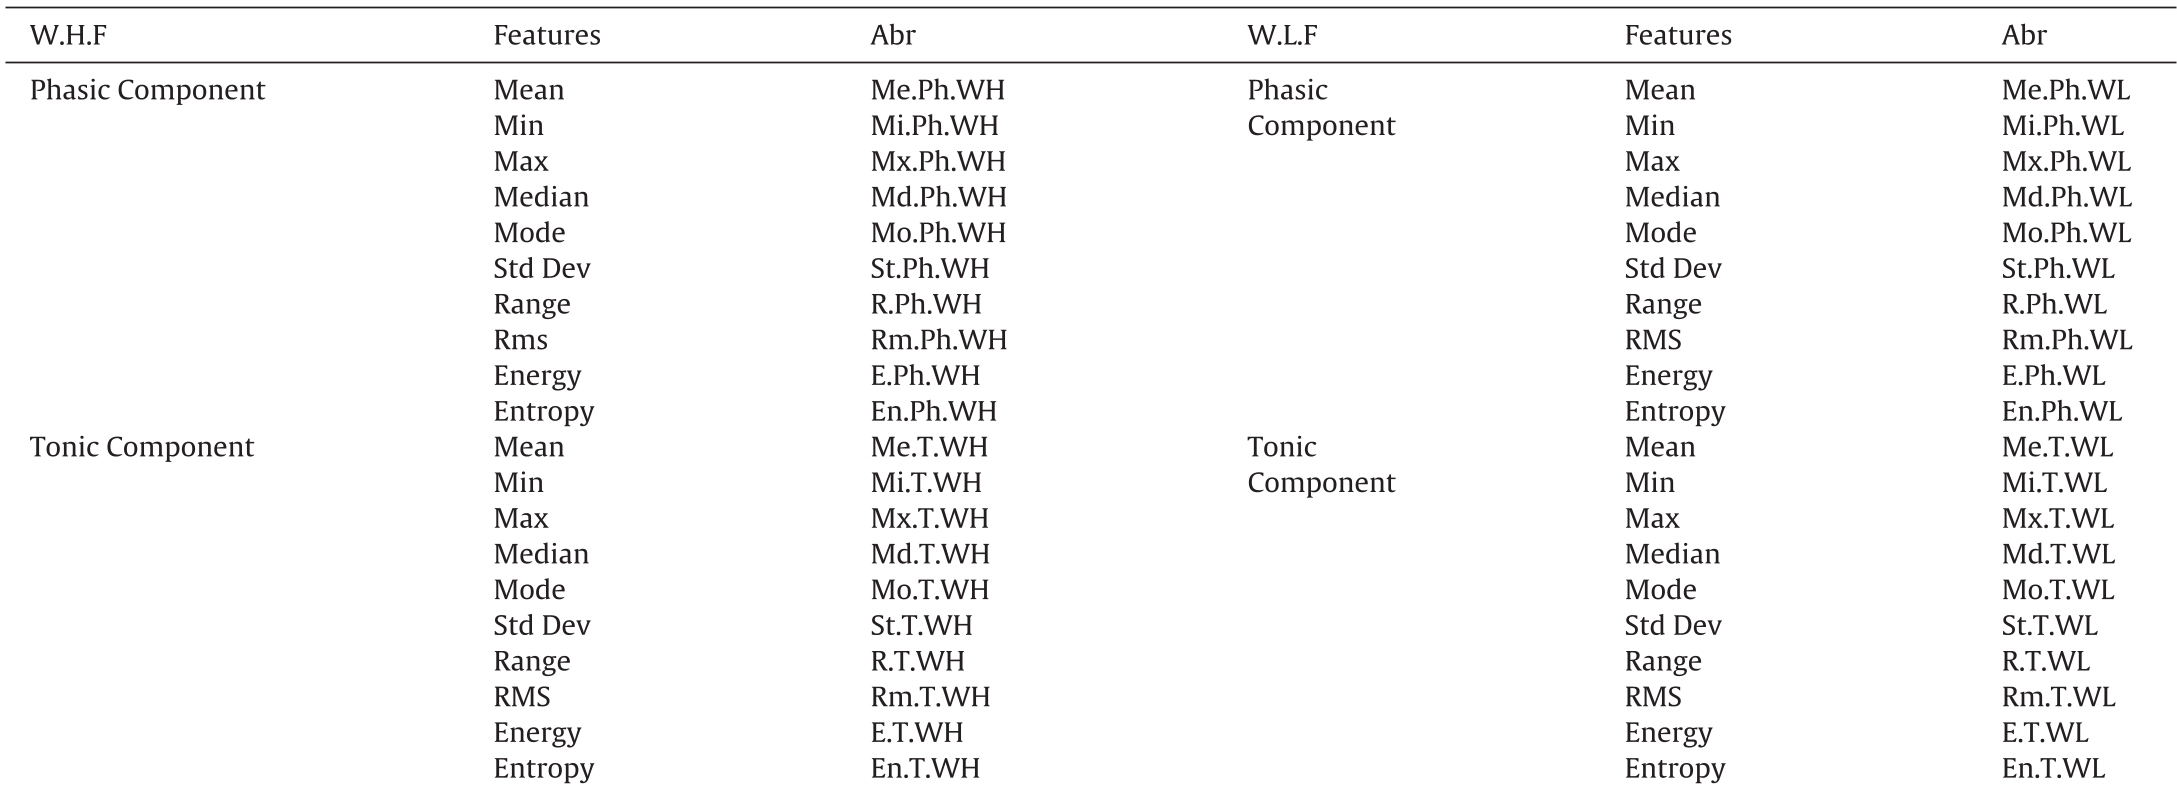 Above: The extensive list of Wavelet features extracted, including Energy, Entropy, and RMS across High and Low-frequency coefficients.
3. Architecture: Optimizing the Neural Mapping
The authors didn't just use a "black box" MLP. They rigorously tested various Backpropagation Algorithms and Error Functions to find the optimal configuration for the three emotional dimensions (Arousal, Valence, Dominance).
- Activation Function: They utilized Leaky ReLU for hidden layers to prevent the "dying neuron" problem and ensure quicker gradient optimization.
- Regression vs. PCA: The study found that Principal Component Analysis (PCA), which accounts for maximum variance, consistently outperformed Stepwise Regression in selecting the most salient features for neural training.
4. Results: Breaking the DEAP Baseline
The experiment involved 32 participants and a grueling 40-trial music video protocol from the DEAP database.
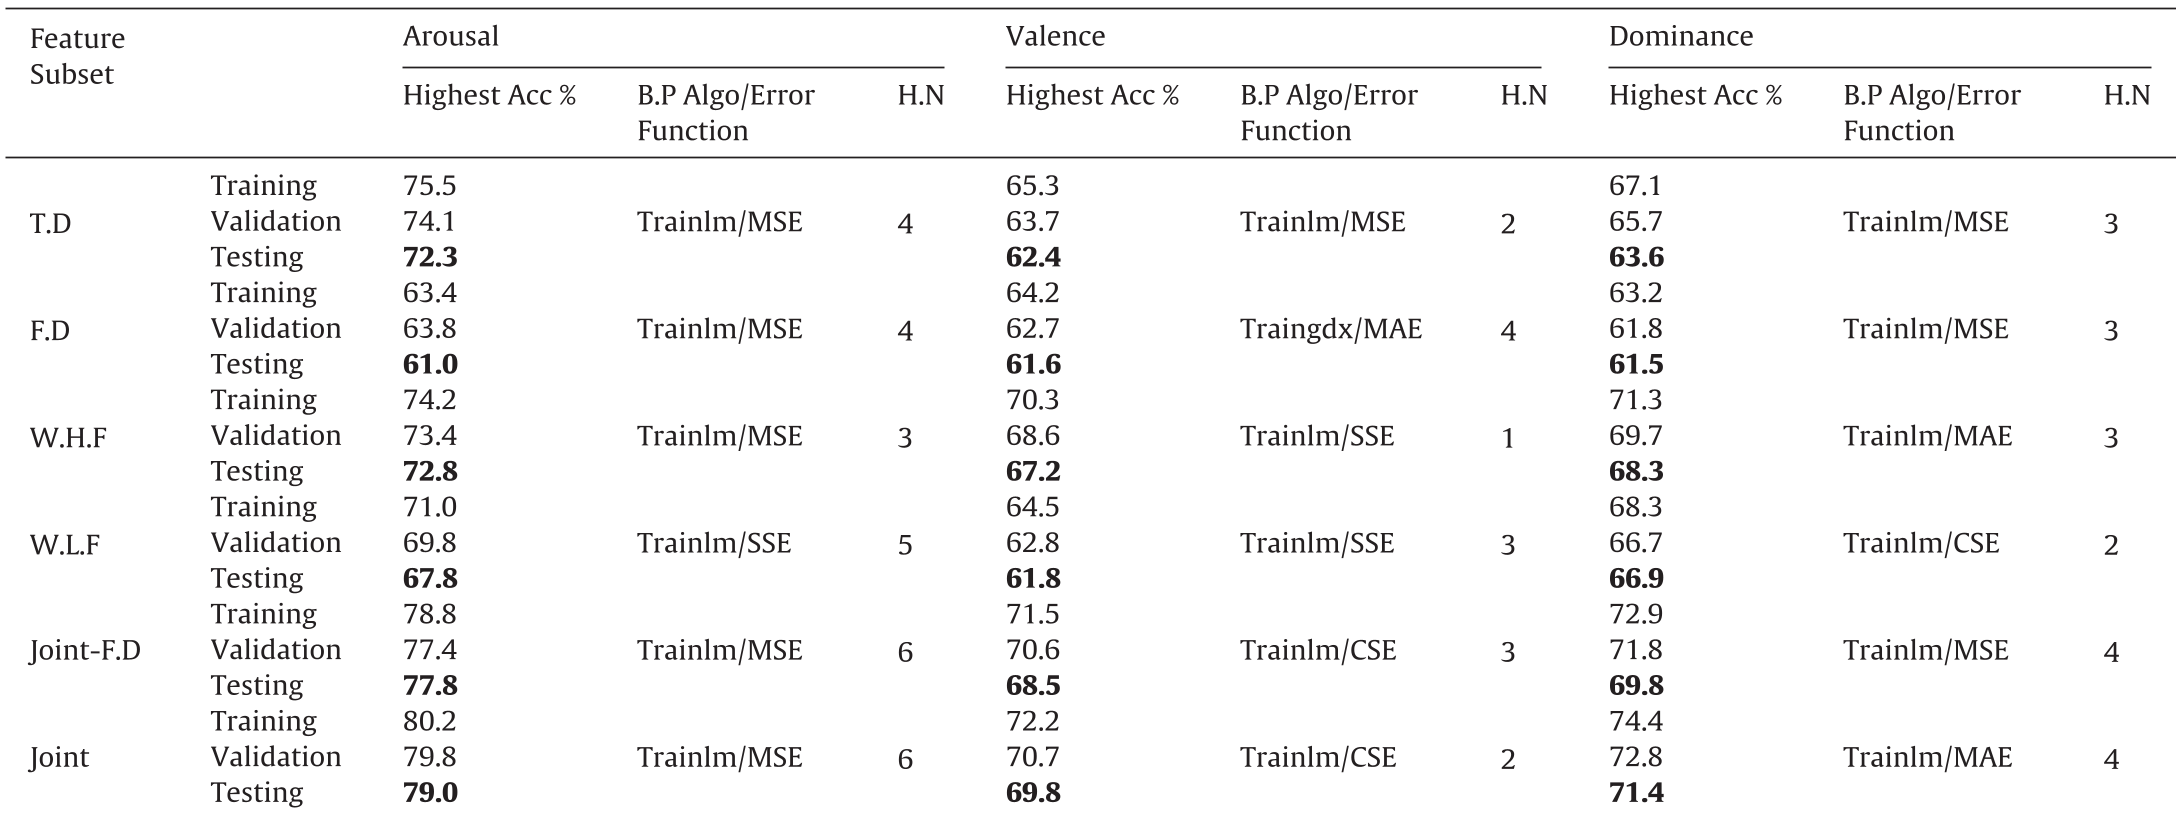
Key Performance Metrics:
- Arousal: 79.0% (Using Joint Features + Levenberg-Marquardt + MSE).
- Valence: 69.8% (Using Joint Features + Levenberg-Marquardt + Cross-Entropy).
- Dominance: 71.4% (Using Joint Features + Levenberg-Marquardt + Mean Absolute Error).
Comparison to Prior Art: Compared to the original DEAP paper (Koelstra et al.), which reported ~57% for arousal using multiple signals, this study achieves significantly higher accuracy using EDA alone.
5. Critical Insight: The "Why"
Why did this work so much better?
- Multi-scale localization: Wavelets captured the "micro-fluctuations" in phasic activity that time-domain averages smoothed over.
- De-biasing: The authors normalized the self-assessment scores (SAM) using z-scores, removing the "subjective bias" where some people naturally rate everything higher or lower.
- Hybrid Approach: The "Joint-F.D" (combining Time, Frequency, and Wavelet) proved that these domains are complementary, not redundant.
Conclusion and Future Outlook
This research elevates EDA from a "crude" measure of stress to a high-fidelity tool for emotional mapping. While it excels at Arousal (the intensity of emotion), Valence (positive vs. negative) remains the harder nut to crack (69.8%). Future work integrating these Wavelet features into Recurrent Neural Networks (RNNs) or LSTMs could better model the temporal dependencies of emotional "flow" in longer media formats.
Final Takeaway: For anyone building affective wearables or marketing analysis tools, the message is clear—stop looking at peaks, start looking at wavelets.