
Beyond the Human Eye: Automated Cardiac RWMA Detection via ICA Shape Morphometrics
Automated Detection of Regional Wall Motion Abnormalities Based on a Statistical Model Applied to Multislice Short-Axis Cardiac MR Images
The paper introduces a statistical shape analysis framework for the automated detection and localization of Regional Wall Motion Abnormalities (RWMA) in multi-slice short-axis cardiac MRI. By utilizing Independent Component Analysis (ICA) on myocardial contraction patterns, the method achieves SOTA-level diagnostic accuracy (up to 89.63% in the mid-ventricular slice) compared to traditional wall thickening (WT) metrics.
TL;DR
Myocardial wall motion assessment is a cornerstone of cardiac diagnostics, yet it remains plagued by the subjectivity of visual scoring. This paper presents a breakthrough statistical framework that uses Independent Component Analysis (ICA) to decompose cardiac contraction into localized "spikes" of motion. Unlike previous global models, this system can automatically pinpoint exactly where a heart wall is failing to contract, matching or exceeding the accuracy of human experts and traditional quantitative metrics.
The Problem: The Subjectivity of the "Naked Eye"
In clinical practice, cardiologists use Visual Wall Motion Scoring (VWMS). This involves grading 17 segments of the heart on a scale from "normo-kinetic" to "dyskinetic." The problem? Inter-observer agreement is notoriously low (kappa coefficients around 0.59). If two experts can't agree on whether a wall is moving normally, how can we ensure reliable patient outcomes?
Prior automated attempts used Principal Component Analysis (PCA), but PCA has a "global bias." If the septal wall moves abnormally, PCA might shift the entire model's geometry to compensate, washing out the local signal. We need a way to isolate "local" failure.
Methodology: The Power of Sparse ICA
The authors' core insight is that ICA naturally favors sparsity and independence. While PCA finds orthogonal axes of maximum variance (global), ICA finds independent sources of variation (local).
1. The Unit Contraction Model
To compare different patients, you can't just look at the raw shapes—hearts come in all sizes. The authors use Thin-Plate Splines (TPS) to warp all end-diastolic (ED) shapes to a common mean, creating a "unit contraction" model. This ensures that the only thing the model measures is the motion from diastole to systole.
2. ICA Decomposition
By applying ICA to these aligned contraction vectors, the model extracts components that correspond to specific anatomical regions.
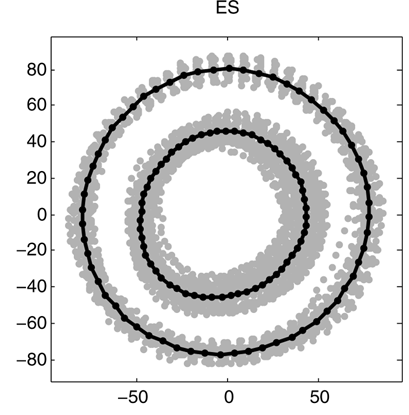 Figure 1: ICA modes showing localized shape variations in specific myocardial segments (LV and RV).
3. Probability Propagation
The real "magic" happens in the math. The authors estimate a non-Gaussian probability density function (PDF) for each ICA component using Kernel Density Estimation. They then propagate these probabilities back into the landmark space. If a specific landmark has a low probability score, it is flagged as "Abnormal."
Experimental Results: Beating the Baseline
The system was tested on 45 patients with ischemic heart disease.
- Mid-ventricular Superiority: The middle slice achieved a staggering 89.63% accuracy.
- ICA vs. Wall Thickening (WT): While WT only measures distance change, the ICA method understands geometry. In cases where the wall "bulged" outward (dyskinetic) but didn't necessarily change thickness, the ICA model correctly flagged the pathology while WT missed it.
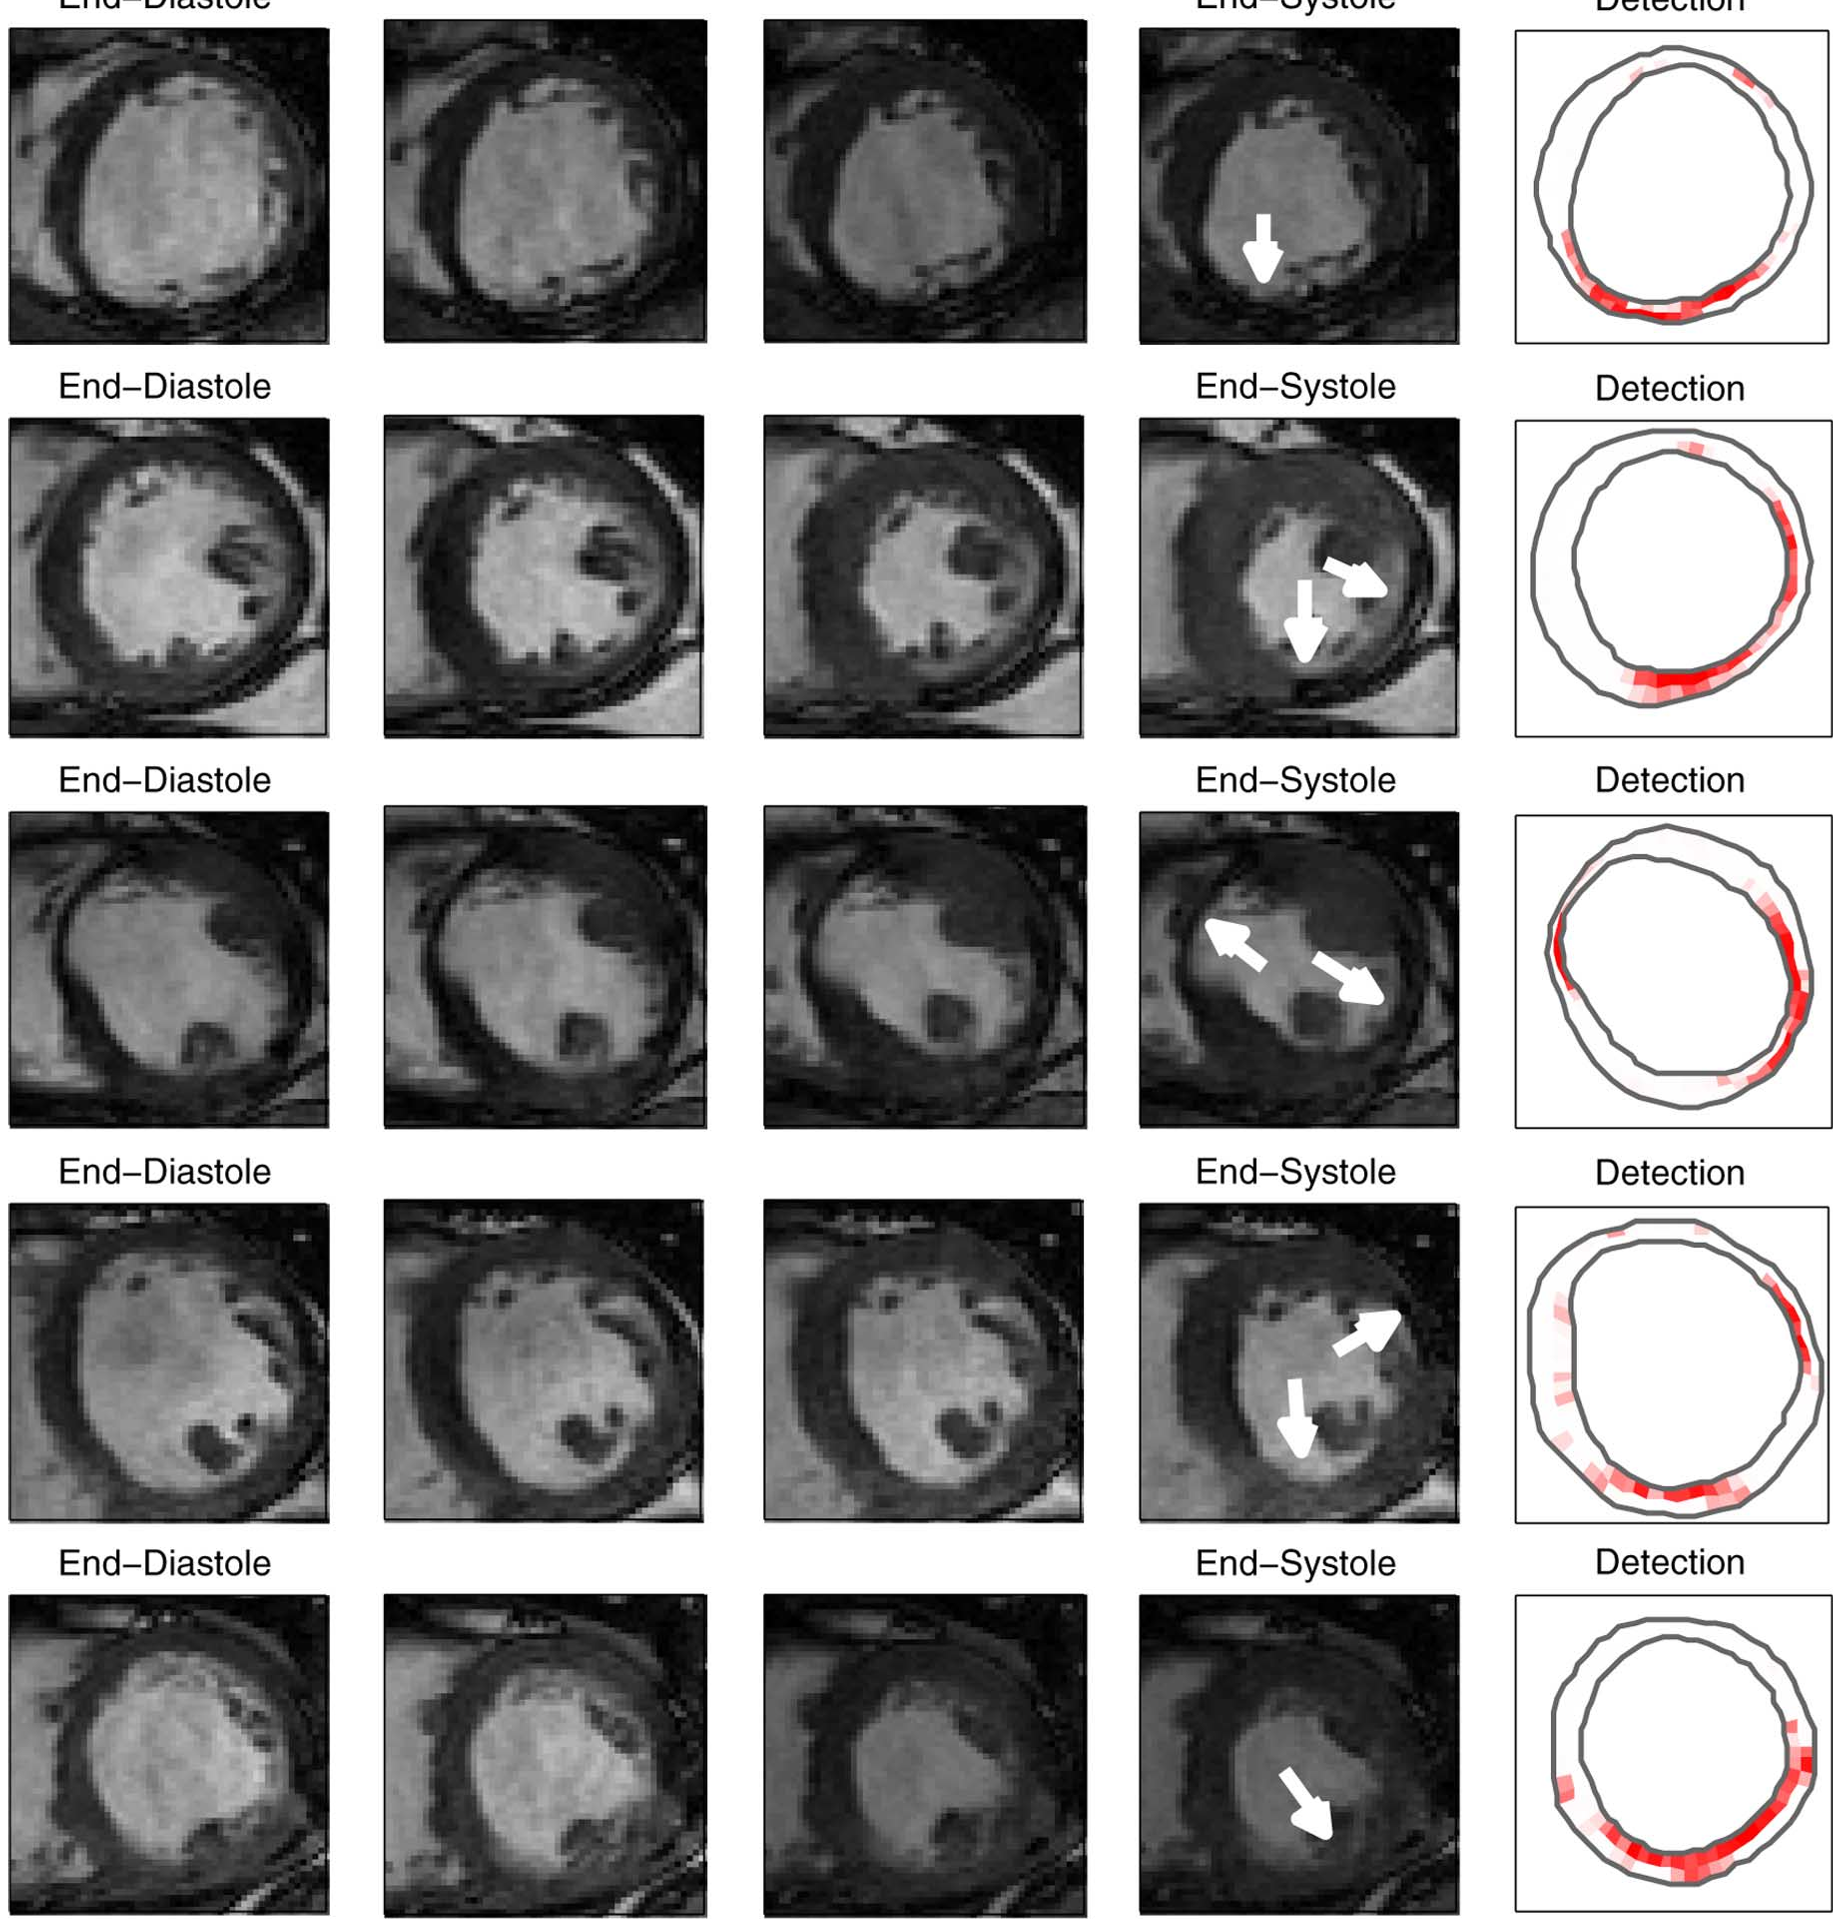 Figure 2: ROC curves demonstrating that the ICA-based method (solid lines) consistently outperforms visual scoring (black dots) across different slice levels.
Critical Insight: Why ICA Wins
The paper includes a brilliant ablation-style comparison: ICA vs. Direct Landmark Estimation. If we just calculated the probability of each point moving, we’d lose the "context." ICA wins because it models landmarks in their "shape context"—it understands that a point's motion is tied to its neighbors. It captures the morphology of contraction rather than just raw pixel displacement.
Conclusion & Future Outlook
This work transitions cardiac MRI from a qualitative art to a quantitative science. While the paper focuses on 2D slices, the logic naturally extends to 3D.
Limitations: The model currently uses only the start (ED) and end (ES) of the heartbeat. Future iterations incorporating the full temporal cine-loop could capture "tardokinesis" (delayed contraction), which this model might currently miss.
The Takeaway: For AI in medical imaging, "Local is King." By forcing the model to look at independent local variations, we can build diagnostic tools that are not just accurate, but also explainable to the clinicians who use them.