
Automated Semantic Analysis: Deciphering the "Language" of Neuronal Growth
9843_Automated semantic analysis of changes in image sequences of neurons in culture.
The paper introduces a highly automated Bayesian framework for the semantic analysis of morphological changes in time-lapse image sequences of live neurons. It combines automated neurite tracing, a novel integral area distance measure, and bipartite graph matching to label short-term changes (growth, shrinkage, merging, splitting) and infer long-term events like apoptosis and axonal specification, achieving 85%–100% accuracy.
TL;DR
Quantifying how neurons grow and interact in culture is a bottleneck in neurobiology. This paper presents an automated pipeline that doesn't just measure pixels, but semantically understands events like axonal specification and apoptosis. By leveraging a Bayesian framework and a novel curve distance metric, it matches human performance at a fraction of the time, turning hours of tedious manual tracing into minutes of automated computation.
Problem & Motivation: The Tedium of the "Human Eye"
In the study of regenerative medicine—targeting diseases like Parkinson's and spinal cord injury—researchers need to know exactly how neurites (the precursors to axons and dendrites) respond to stimuli. Historically, this meant a PhD student sitting in a dark room, manually clicking on pixels across hundreds of time-lapse frames.
Current automated tools often fail because:
- Complexity: Neurites merge, split, and cross in three-dimensional space.
- Imaging Artifacts: Phase-contrast microscopy produces "halos" that confuse standard segmentation algorithms.
- Nuisance Changes: Flickering lights or shifting backgrounds are often mistaken for biological growth.
The authors' insight was to move beyond simple pixel-diffing. They treated neurite changes as a model selection problem, asking: "Which biological behavior (Growth? Shrinkage? Merge?) best explains the transition between Frame A and Frame B?"
Methodology: The Bayesian Framework
The system follows a sophisticated multi-stage pipeline:
1. The Core Architecture
The workflow integrates image registration, change mask generation, and neurite tracing. The "intelligence" lies in the Change Model Selection block.
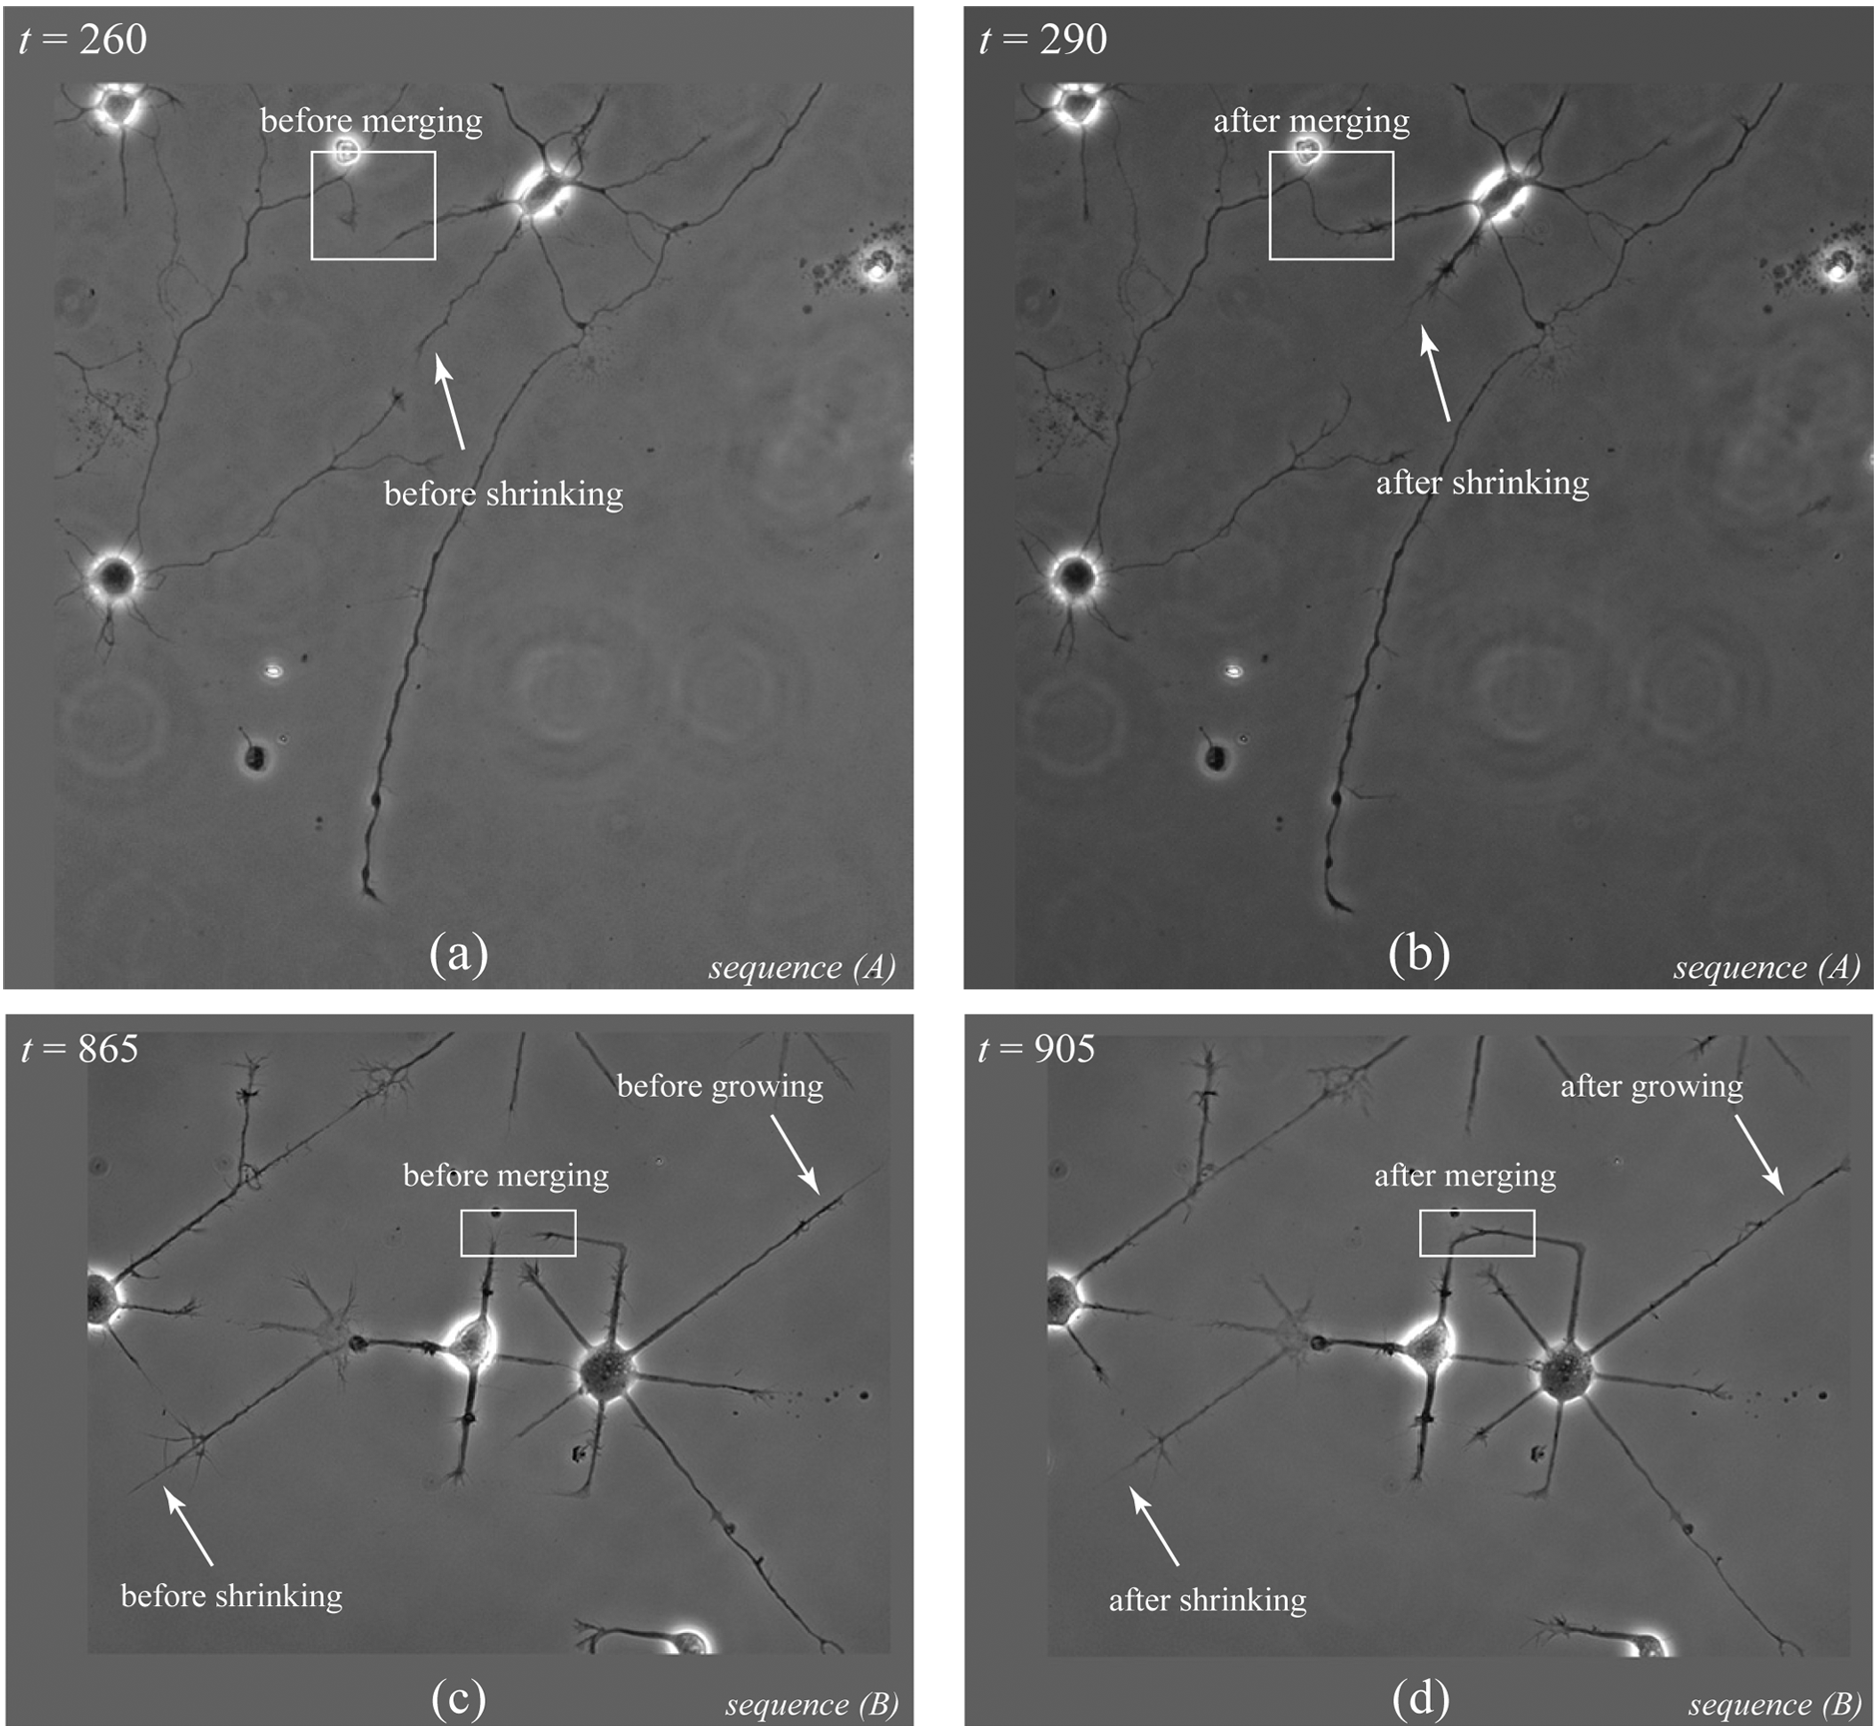 Figure 1: The overarching framework integrating low-level image processing with high-level semantic analysis.
2. Integral Area Distance
Standard metrics like Hausdorff distance are brittle; a single outlier pixel can ruin the measurement. The authors proposed the Integral Area Distance, which uses dynamic programming (Dijkstra’s) to find the "closest path" between two parameterized curves. This allows for a robust estimation of the growth parameter .
3. Bayesian Model Selection & Graph Matching
For every pair of potential neurite matches, the system calculates the posterior probability of various models (No Change, Growth/Shrinkage, Merge/Split) using:
- Distance Evidence: How well the curve geometry fits.
- Mask Evidence: Are there "changed" pixels in the area where we think growth occurred?
To solve the global optimization problem (who belongs to whom?), they use Weighted Bipartite Graph Matching. Every possible neurite in Frame is a node, every neurite in Frame is another, and edge weights represent the Bayesian probability of their association.
Experiments & Results: Human-Level Accuracy
The method was tested on eight sequences, ranging from neurons on smooth surfaces to complex chemical patterns.
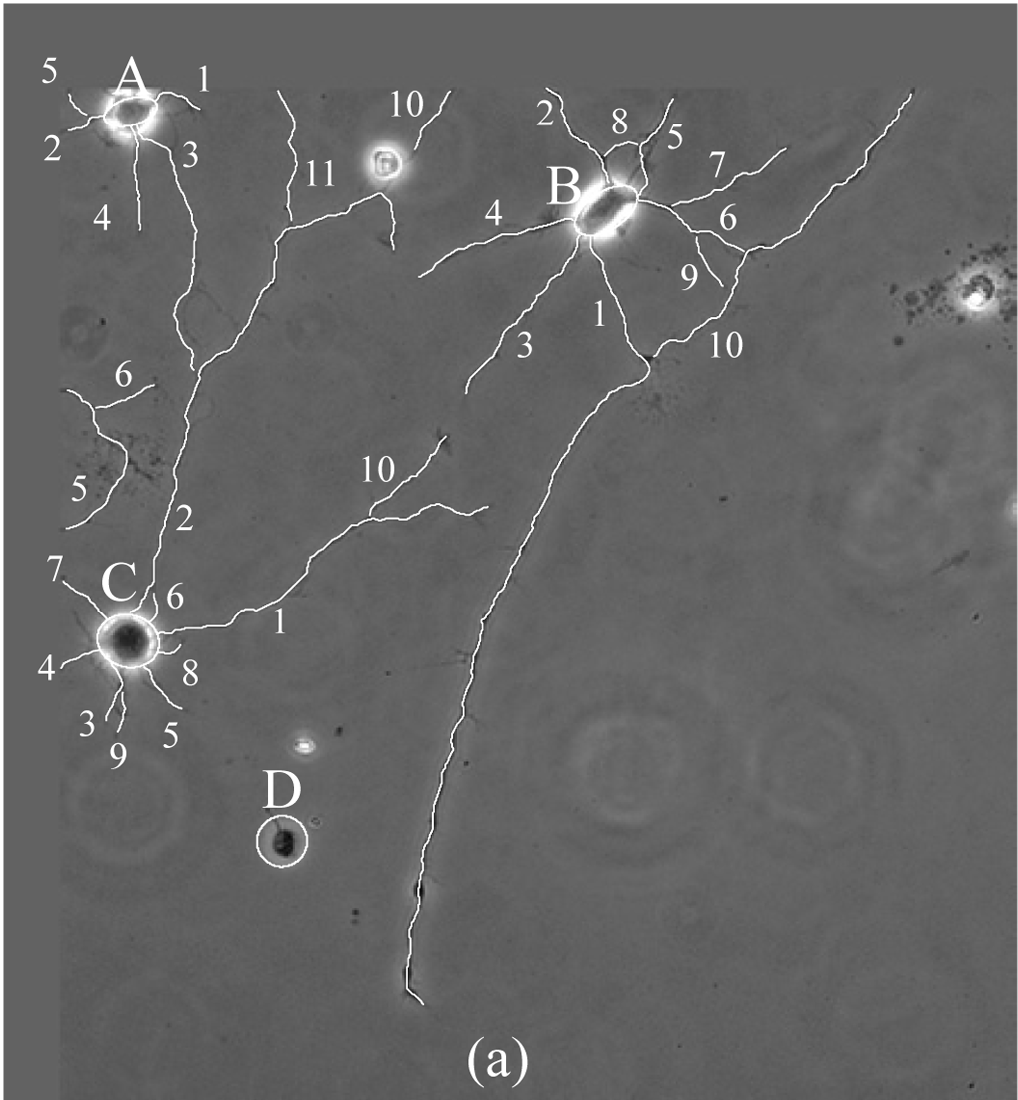 Figure 2: Example of automated semantic labeling. Labels like "shrinkage (0.027)" and "merge (0.045)" are assigned with probabilistic confidence.
Key Performance Metrics:
- Accuracy: Frame-to-frame change labeling achieved 85% to 100% accuracy.
- Speedup: A task that took an expert 6+ hours was finished by the algorithm in 43 minutes.
- High-Level Inference: The system successfully identified "axonal specification" (when one neurite outgrows others by 15μm) and "apoptosis" (cell death/collapse) across long sequences.
Critical Analysis & Conclusion
Takeaway
The real value of this work is the semantic abstraction. By providing a "list of events" rather than just a "folder of images," it allows biologists to perform high-throughput discovery. It addresses the "Why" behind the movement, not just the "What."
Limitations
A significant portion of the remaining errors (approx. 15%) originated from the initial neurite tracing phase. If the tracer misses a small branch due to a phase-contrast halo, the semantic engine might label it as a "deleted branch."
Future Outlook
While this paper uses traditional geometric models, the framework is modular. Replacing the tracing and mask blocks with modern Deep Learning (like U-Net or Graph Neural Networks) while keeping the Bayesian logic for event interpretation could lead to a virtually flawless automated assay system.
Primary Source: Al-Kofahi et al., "Automated Semantic Analysis of Changes in Image Sequences of Neurons in Culture," IEEE Transactions on Biomedical Engineering.