
Piercing the Filter Bubble: How Interactive Visualization Restores Trust in Social Streams
Providing Awareness, Understanding and Control of Personalized Stream Filtering in a P2P Social Network
The paper introduces an interactive visualization tool for MADMICA, a decentralized P2P social network, designed to provide transparency into personalized stream filtering. By adopting a "filter bubble" metaphor, the system allows users to see hidden content and manually adjust filtering parameters to balance relevance with serendipity.
TL;DR
Personalization algorithms in social media often hide more than they reveal, creating a "black box" effect known as the Filter Bubble. This research introduces an interactive visualization for a P2P social network (MADMICA) that allows users to see what is being filtered out and why. By enabling users to drag and drop interests back into their feed, the system significantly boosts user trust and awareness of their digital boundaries.
Problem & Motivation: The Opaque Filter
In the modern "fire hose" of social data, filtering is a necessity. However, current platforms like Facebook or YouTube provide zero transparency. Users don't know why a post was hidden or what they are missing. This leads to two critical failures:
- Declining Trust: Users feel manipulated by hidden algorithms.
- The Filter Bubble: Algorithms over-optimize for existing interests, creating a feedback loop that starves users of diversity and serendipity.
The authors argue that the solution isn't just a better algorithm, but a better interface that provides awareness, understanding, and control.
Methodology: The Bubble Metaphor
The core innovation is a visualization based on the "Bubble" metaphor, implemented in the MADMICA P2P social network.
1. Dual-Perspective Visualization
The system offers two distinct views to help users parse the filtering logic:
- Category View: Aggregates posts into semantic topics (e.g., "Sports", "Education"). Circles inside the bubble are shown in the feed; circles outside are hidden.
- Friends View: Focuses on social circles, showing which friends' updates are currently prioritized or suppressed based on the user's past interactions.
2. Interactive Control (The "Drag and Drop")
Unlike passive dashboards, this system allows users to actively manipulate their user model. If a user notices "Mobile Technologies" is outside their bubble, they can simply drag it inside. This triggers an AJAX request to update the underlying interest-based relationship model instantly.
 Figure 1: The Category View using the bubble metaphor to distinguish visible vs. hidden content.
Experiments & Results: Evidence of Trust
The authors conducted a study with 11 graduate students over three weeks. The results confirm that transparency breeds confidence.
- Awareness: Over 90% of users understood that the visualization represented their filtered environment.
- Trust Building: Trust in the system's filtering rose dramatically once users could see the "Hidden Posts" through the visualization.
- Countering the Bubble: Most user actions were "dragging in" interests that the algorithm had previously discarded, proving that users actively desire more diversity than a standard algorithm provides.
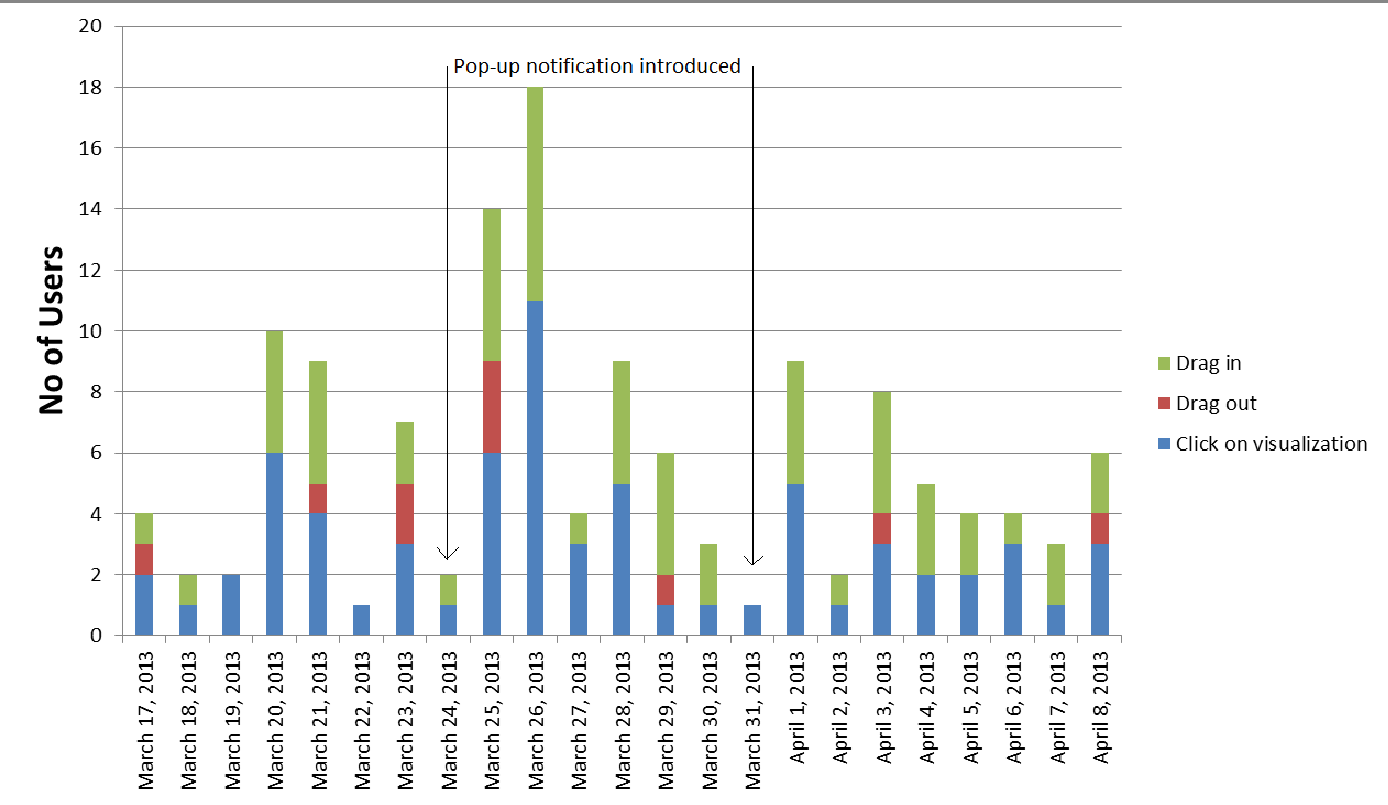 Figure 2: Tracking user interactions. Note the spike in activity when the system first notified users of hidden content.
Critical Analysis & Conclusion
Takeaway
The paper successfully demonstrates that scrutability—the ability for a user to inspect and correct their profile—is a powerful tool against the negative externalities of AI. By moving from a "system-controlled" to a "mixed-initiative" approach, OSNs can remain relevant without being isolating.
Limitations & Future Work
The study was small-scale (11 participants) and involved technically savvy users (CS grads). A major challenge remains: Scalability. As categories grow from 11 to 1000, how does the bubble metaphor hold up without creating "cognitive overload"? Future research must explore how to represent complex, high-dimensional interest spaces without losing the intuitive simplicity of the bubble.
This work serves as a foundational blueprint for any developer building "human-in-the-loop" recommendation systems where ethics and transparency are as important as precision.