
Decoding Consumption: How Big Data Reinvents Socioeconomic Mapping
What Banking and Phone Data Tell us about the Socioeconomic Groups and Their Consumption Patterns?
This paper leverages a multi-modal dataset of anonymized banking transactions and mobile phone records to classify millions of individuals into Socioeconomic Groups (SEGs). By mapping Merchant Category Codes (MCC) to the COICOP standard, the authors provide a data-driven validation of consumption patterns that correlates strongly with social networks and national census data.
TL;DR
Researchers have successfully used a combination of bank transactions and mobile phone records to map the socioeconomic status and spending habits of millions. The study proves that digital footprints are not just noise; they are highly accurate reflections of wealth, social circles, and consumption behavior, often surpassing the accuracy and reach of traditional government surveys.
Background: The Failure of the Survey
For decades, the "Household Survey" has been the gold standard for measuring a nation's pulse. However, these surveys are plagued by non-response bias (the rich don't have time to answer) and memory bias (participants forget small expenditures). In the digital age, we no longer need to ask people what they spend; their bank accounts and smartphones are already telling the story.
Problem & Motivation: The Gap in the Middle
Traditional economic data faces a paradox: in developing countries, it’s hard to track income due to self-employment; in developed countries, it’s hard to track spending due to survey fatigue. The authors seek to bridge this gap by using a bottom-up, data-first approach. By integrating banking data (BDS) with phone data (PDS), they aim to create a "ground truth" for socioeconomic groups (SEGs) that doesn't rely on subjective reporting.
Methodology: The Fusion of Finance and Social Circles
The core of the methodology lies in two distinct verification steps:
1. Social Homophily as Validation
The researchers posited that "who you talk to" reflects "how much you earn." They built a friendship metric based on:
- Frequency: Number of interactions between users.
- Intensity: Total duration of calls.
By overlaying this social graph with bank-verified income, they discovered a striking diagonal correlation (see the Homophily plot below), proving that people tend to socialize within their own SEG.
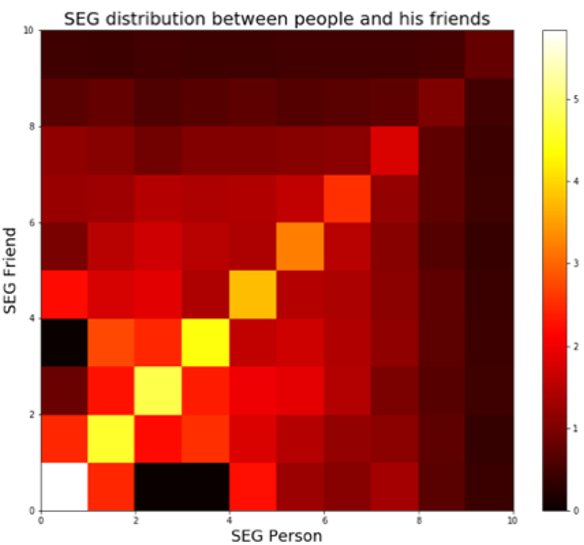 Fig 1: The "Diagonal of Homophily" shows that individuals predominantly connect with others in the same SEG, validating the income-based classification.
2. Mapping Consumption (MCC to COICOP)
Bank data uses Merchant Category Codes (MCC), but economists use COICOP. The authors mapped millions of transactions into 12 standard categories (Food, Transport, Health, etc.). This allow for a direct "apples-to-apples" comparison with national accounts.
Experiments & Results: The Wealth Signature
The analysis revealed distinct "signatures" for different wealth levels.
- The Wealthy (SEG 10): Spend a much smaller fraction of their income on necessities like food but significantly more on "Miscellaneous" (financial services) and restaurants.
- The Middle Class: Show high consistency in department store and wholesale club spending.
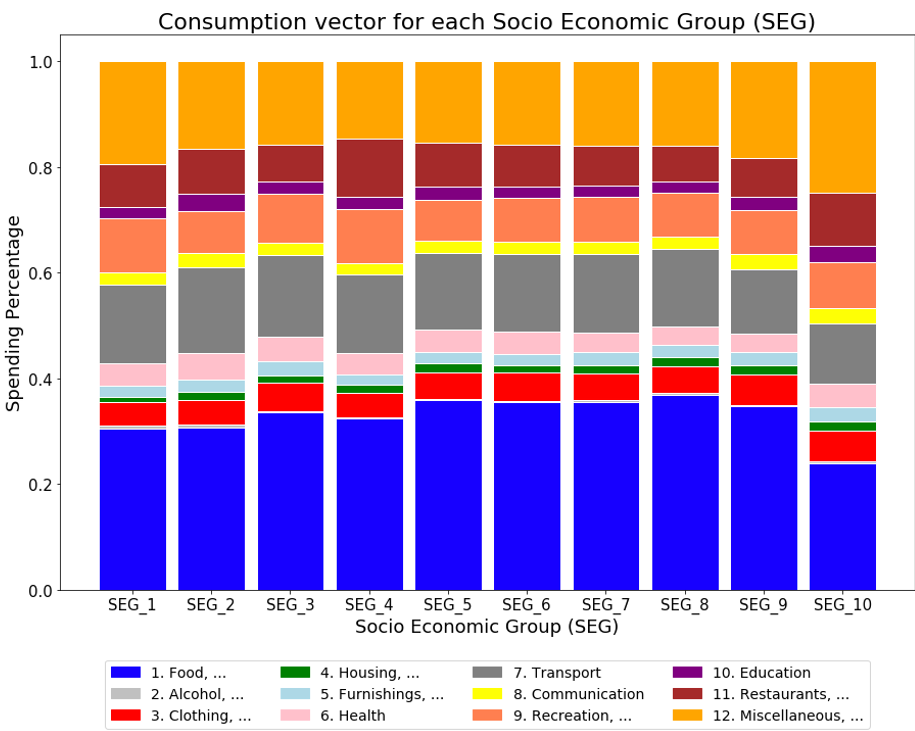 Fig 2: Expenditure breakdown across the 12 COICOP categories for different socioeconomic levels.
When compared to traditional surveys, the Big Data results were within a 15% margin of error. The discrepancies (notably in housing) actually highlight where digital data might be superior—identifying areas where people use cash vs. digital payments.
Critical Analysis & Conclusion
Takeaway
This research confirms that anonymized banking and telecom data are robust proxies for socioeconomic analysis. The ability to use the social network (phone data) to "fill in the blanks" for individuals without bank accounts is a game-changer for financial inclusion.
Limitations
- Digital Divide: The study acknowledges that the poorest individuals (under-banked) are still harder to capture, though phone data helps mitigate this.
- Cash Bias: Some categories, like "Housing" or small retail, are still heavily cash-dependent, which banking datasets might under-report.
Future Outlook
As the world moves toward 100% digital payments, the need for manual household surveys will likely vanish. We are moving toward a "Real-Time Economics" where policy decisions can be made based on last week's spending patterns rather than last year's survey results.