
Unified TSDM: Decoding the Heartbeat of National Economics through Port Logistics
A baseline time series data mining model for forecasts in port logistics and economics
This paper proposes a model-based Time Series Data Mining (TSDM) framework for port logistics and economic forecasting. By integrating multiple imputation for missing data, multivariate outlier detection, and ARIMA-based pattern discovery, the study establishes a predictive relationship between port throughput (Buenaventura) and national coffee exports in Colombia.
TL;DR
Predicting national economic trends is notoriously difficult in developing nations due to data gaps and volatile markets. This paper introduces a Time Series Data Mining (TSDM) baseline that turns port throughput data into a "crystal ball" for national exports. By combining rigorous statistical imputation with ARIMA modeling, the researchers demonstrate that the efficiency of the Buenaventura Port (Colombia) explained nearly 79% of national coffee export variations between 2001 and 2005.
The Problem: Data "Holes" and Economic Turbulence
Most logistics forecasting models fail when they move from the lab to the real world—specifically to developing economies. The authors identify two primary blockers:
- Missing Data: Traditional models break when faced with incomplete records, which are common due to the high cost of data collection in regions like South America.
- Outlier Sensitivity: High volatility (e.g., post-privatization instability) creates "random walk" processes where past data seems to have no logical connection to the future.
Instead of ignoring these issues, this research posits that the time series is governed by an underlying model that can be uncovered if we treat preprocessing as a core part of the learning task.
Methodology: The TSDM Pipeline
The researchers developed a model-based approach that shifts the focus from simple data tracking to Pattern Discovery.
1. Handling the Incomplete (Multiple Imputation)
Rather than simply deleting incomplete rows, the study uses Multiple Imputation of Incomplete Multivariate Data (Amelia II). This assumes that data is "Missing at Random" (MAR) and uses correlations between variables to fill gaps, ensuring the "smoothness" of the time series is preserved.
2. Identifying Hidden Signatures
The core of the methodology lies in identifying three types of patterns:
- Persistence: Does the series follow a trend, or is it just noise?
- Outliers: Classifying data points as Additive Outliers (one-time spikes) or Innovational Outliers (shocks that change the trend).
- Leading Indicators: Using cross-correlation to see if Port Throughput (internal factor) moves before National Exports (macroeconomic factor).
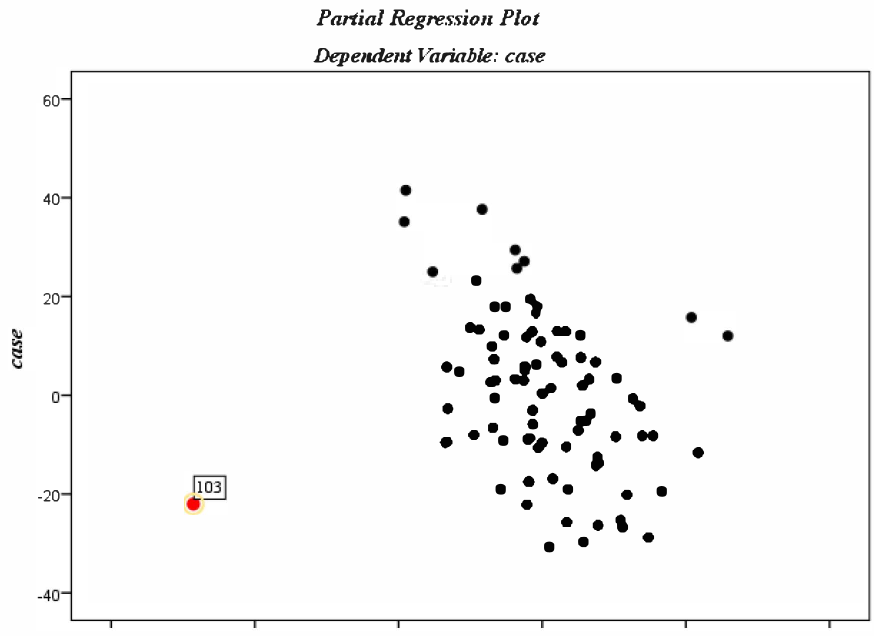 Figure 1: Detection of multivariate outliers using Mahalanobis distance to isolate cases that deviate from the centroid.
Experimental Results: Port Efficiency as an Economic Engine
The study compared two distinct 5-year spans. The findings reveal a stark contrast in economic matureness:
- 1999–2003 (The Volatile Era): Following port privatization, the series was plagued by outliers. It behaved like a Random Walk, meaning the port throughput had little predictive power over the national economy.
- 2001–2005 (The Predictive Era): As the economy stabilized, the model hit its stride. The Port Performance Indicator (PPI) for coffee (tons) became a primary lead for national exports.
| Metric | Segment 2001-2005 |
|---|---|
| Stationary R-Squared | 0.787 |
| Ljung-Box (Q) | 0.568 (Non-significant, indicating good fit) |
| Forecast Horizon | 5 Months Ahead valid within 95% CI |
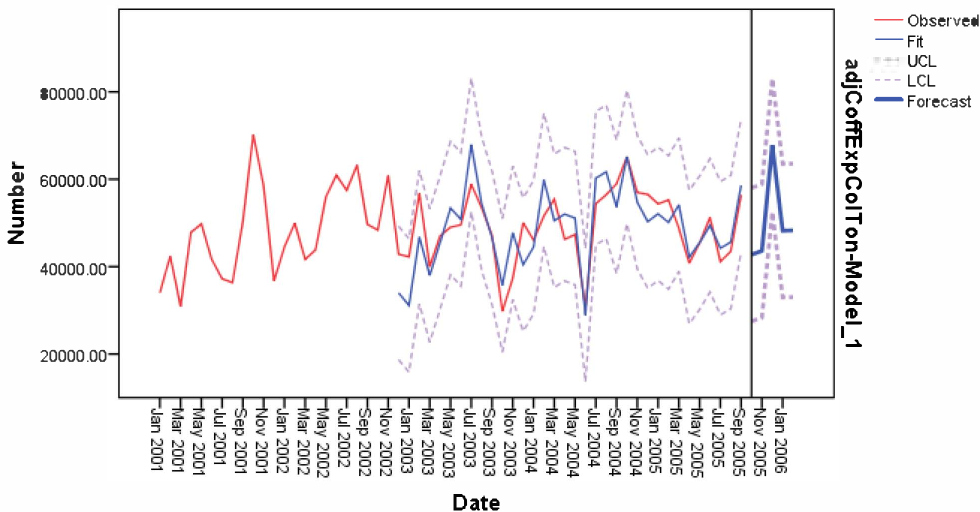 Figure 2: The fitting plot for the 2001-2005 span, showing how the forecasted values (solid line) closely track the observed economic data.
Academic Insight: Why This Matters
The "magic" isn't in the ARIMA model itself—it's in the feature extraction and classification. By classifying outliers (AO, IO, LS), the researchers could tell why certain periods were unpredictable. They transformed a "black box" statistical task into a Knowledge Discovery process.
The transition from a random walk to a high-fit ARIMA model (R²=0.787) is empirical proof that as logistics infrastructure matures, its impact on the national macro-economy becomes quantifiable and, more importantly, forecastable.
Conclusion & Future Outlook
This paper provides a robust baseline for Intelligent Decision Support Systems (IDSS) in maritime logistics. While the model relies on the linear assumptions of ARIMA, it paves the way for integrating non-linear dynamics and chaos theory into port management. For practitioners, the takeaway is clear: your port's daily throughput is not just a logistics metric; it is a leading indicator of your country's economic future.
Limitations: The model struggles with highly dynamic, non-stationary behaviors that do not follow seasonal patterns, suggesting a need for more flexible machine learning architectures in future iterations.