
Beyond One-Size-Fits-All: Predicting User Success in Data Visualization through Behavior Analysis
Using Behavior Data to Predict User Success in Ontology Class Mapping - An Application of Machine Learning in Interaction Analysis
The paper introduces a machine learning approach to predict user performance in ontology class mapping tasks using real-time behavior data. By leveraging eye gaze metrics and event logs, the authors developed predictive models (LogitBoosted Decision Stumps) that outperform baseline classifiers in determining user success.
TL;DR
Researchers have developed a way to predict whether a user will succeed or fail at complex data mapping tasks in real-time. By analyzing eye-movement patterns (gaze) and mouse clicks, a Machine Learning model can "know" if the current visualization is working for the user, paving the way for interfaces that adapt themselves on the fly.
Context: The Rigidity of Data Tools
In the world of Semantic Web and Big Data, Ontology Visualization (like node-link diagrams or indented lists) is the primary lens through which we understand complex relationships. However, these tools are static. What works for a PhD-level biologist might be incomprehensible to a clinical practitioner.
Current systems treat all users the same. This paper argues that instead of just blaming "bad UI," we should monitor user behavior to detect cognitive friction and intervene before the user fails.
Methodology: Reading the User's Mind through their Eyes
The study monitored users as they performed "Ontology Class Mapping"—the task of aligning concepts between two different datasets. The authors tracked several high-level behavior metrics:
- Fixation & Saccades: Where you look and how your eyes transition between points.
- Convex Hull: The "area of interest" on the screen. A massive, scattered area usually suggests a confused search.
- Pupil Dilation: A biological signal of high cognitive workload (the brain working harder).
- Event Logs: Generic mouse clicks to indicate interaction intensity.
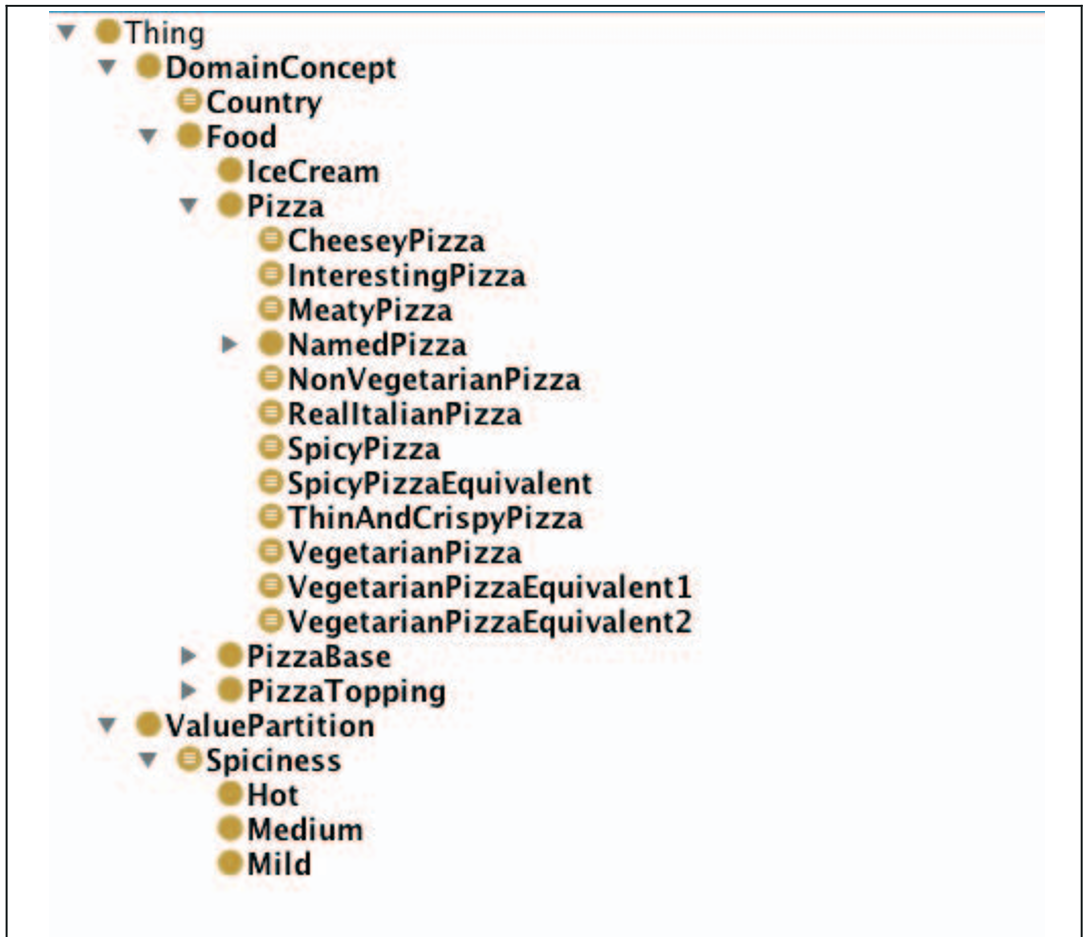 Figure 1: Comparison between Indented Lists (a) and Node-Link Diagrams (b).
The Predictive Power of Dispersion
The researchers found that Standard Deviation was their most potent feature. If a user's saccadic angles (the direction of their eye jumps) or fixation durations varied wildly (high standard deviation), it was a strong predictor of low success. This is the physiological signature of "getting lost."
Experimental Results
Using a LogitBoosted Decision Stump model, the researchers attempted to classify users into "High Success" or "Low Success" categories.
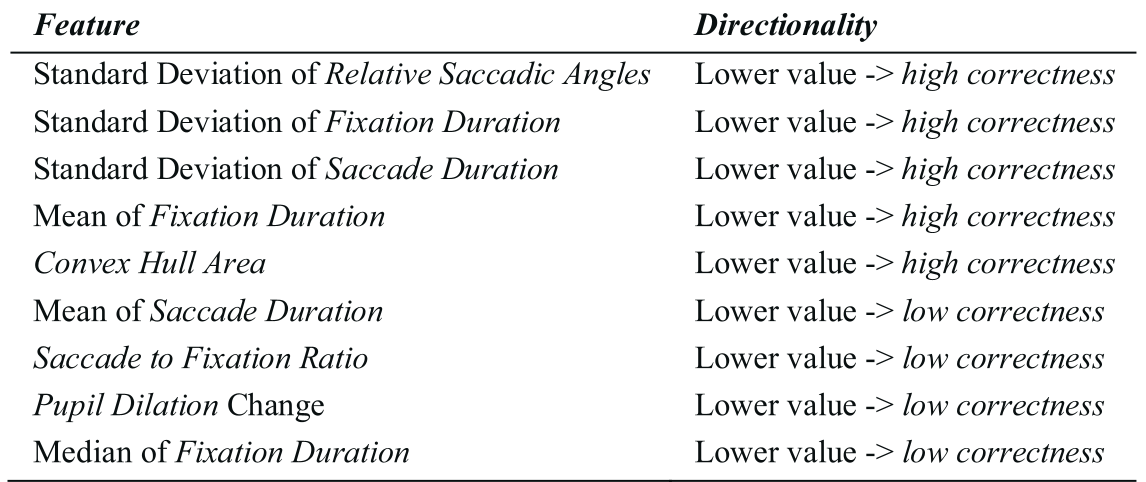 Table: Key features influencing the prediction of Overall Success.
- Completeness Prediction: 66.13% Accuracy (vs. 51.61% baseline).
- Overall Success: 64.52% Accuracy.
- The "Tell": Users who were about to succeed had smaller Convex Hull areas and fewer, more purposeful clicks.
Critical Insight & The Future of "Adaptive Help"
The accuracy (~65%) suggests that while behavior data is a powerful signal, it's not a silver bullet. We aren't yet at a stage where the UI should completely morph itself without warning (which would likely confuse the user further).
Instead, the authors propose Adaptive Help. If the model detects a "Low Success" trajectory, the system could:
- Suggest a different visualization layout.
- Highlight the areas of the screen the user has missed.
- Open a "Recommendation Sidebar" to guide the next step.
Limitations & Next Steps
The study focuses on novice users. Experts might exhibit different "successful" gaze patterns (e.g., rapid scanning that looks like confusion but is actually high-speed pattern matching). Future iterations will need to incorporate User Expertise as a latent variable.
Conclusion
This paper shifts the paradigm of UI design from "Universal Design" to "Adaptive Interaction." By treating user behavior not just as an evaluation metric, but as a real-time input stream, we can create software that empathizes with the user's cognitive struggle.