
Digital Pulse of Berlin: Deciphering Public Safety via Police Twitter Streams
Analysis of data from the Twitter account of the Berlin Police for public safety awareness
This paper presents a comprehensive analysis of the Berlin Police's Twitter account (@PolizeiBerlin) to enhance public safety awareness. By utilizing Natural Language Processing (NLP) and keyword-based categorization, the study extracts spatial-temporal patterns of urban incidents from over 5,000 tweets, including data from high-intensity #24hPolizei Twitter marathons.
TL;DR
In the age of instant information, the Berlin Police Department uses Twitter not just for announcements, but as a real-time ledger of city life. This study analyzes 5,021 tweets to map out where, when, and what incidents occur in Berlin, revealing distinct "Safety Fingerprints" for different districts and highlighting how social media marathons can provide unprecedented transparency into law enforcement operations.
The Motivation: From Micro-blogging to Situational Awareness
Law enforcement agencies are no longer just reactive forces; they are becoming proactive information hubs. The authors argue that while personal tweets are often noisy, official police feeds offer a structured (yet under-analyzed) goldmine of data. The goal is to move beyond simple "notification" and toward Situational Awareness—a state where citizens understand the risks and patterns of their environment in real-time.
Methodology: Parsing the "Polizei" Lexicon
To turn raw German tweets into actionable data, the research team implemented a pipeline focused on two core pillars:
- Spatial Normalization: Utilizing the Stanford NER tool supplemented by a specialized dictionary of S-Bahn and U-Bahn stations to pinpoint incidents.
- Incident Taxonomy: Tweets were filtered through a keyword-based classifier focusing on:
- Public Disorder (e.g., noise complaints, brawls)
- Theft (e.g., pickpocketing)
- Traffic Accidents
- Break-ins

The "Safety Fingerprint" of Berlin Districts
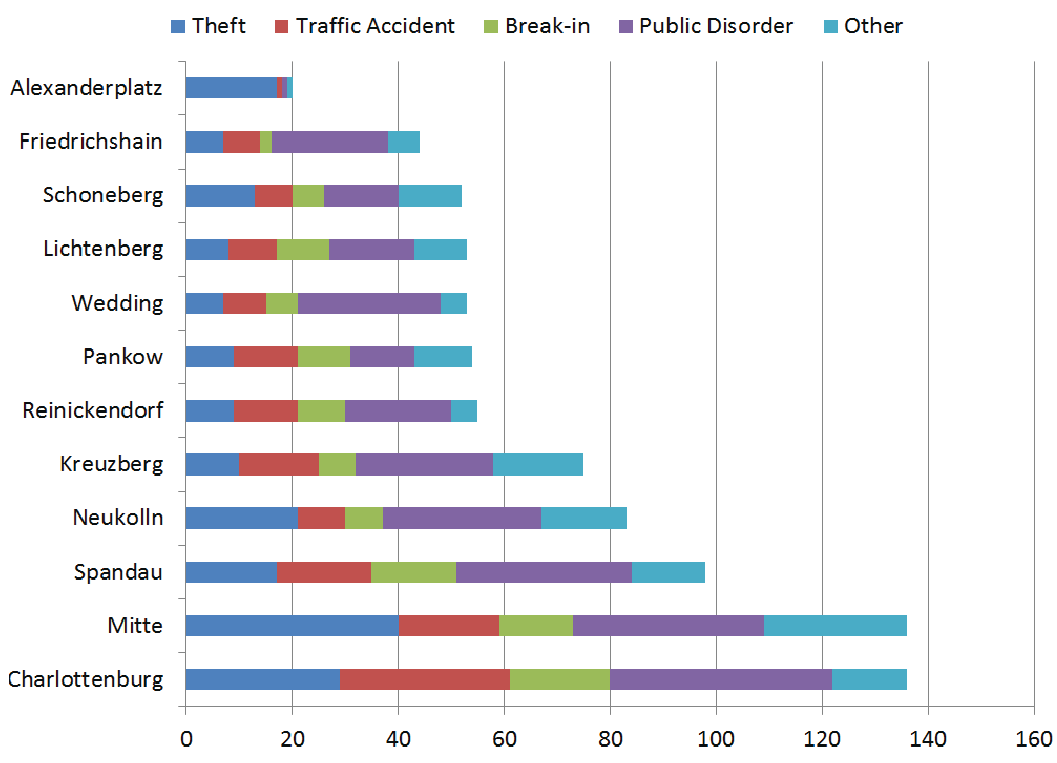
The analysis reveals that Berlin's crime landscape is highly geographical:
- Mitte (City Center): The undisputed capital of Theft. Crowded tourist spots like Alexanderplatz see a significant concentration of pickpocketing (85% of its recorded incidents).
- Charlottenburg: A multifaceted district that dominates in Traffic Accidents and Public Disorder.
- Kreuzberg & Neukölln: High activity areas fueled by nightlife, showing consistent Public Disorder reporting.
High-Intensity Analysis: The #24hPolizei Marathons
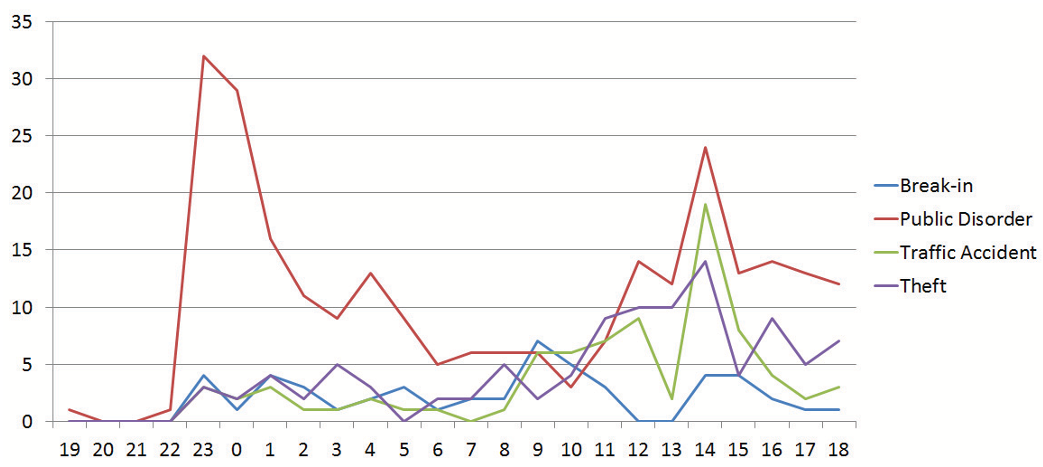
One of the paper's most fascinating sections investigates the "Twitter Marathons"—24-hour windows where the police live-tweet nearly every call received via the 110 emergency line.
The data reveals a stark temporal shift. While "Theft" is the leading category across the multi-year dataset, Public Disorder becomes the overwhelming leader during the marathons (nearly 50% of all activity). The temporal charts show a "Public Disorder Peak" between 11:00 PM and 3:00 AM, likely correlating with the city's vibrant weekend nightlife.
Critical Analysis & Future Outlook
The study demonstrates that public data can provide deep insights without violating individual privacy. However, a significant limitation remains: Dictionary-based classification. As language evolves and slang changes, fixed dictionaries become brittle.
Future directions proposed by the authors include:
- Machine Learning Integration: Moving toward probabilistic classifiers to handle "Other" category tweets more effectively.
- Multi-Source Fusion: Combining police tweets with data from the Fire Department, BVG (transport), and crowdsourced geotagged social media to create a "Unified Safety Map."
- Precise Geolocation: Using Google Maps API to convert text-based street names into exact coordinates (Lat/Long) for heat-map visualization.
Conclusion
This research proves that the Twitter feed of a city’s police force is more than just social media—it is a vital sensor in the urban ecosystem. By structuring this "digital exhaust," researchers can help citizens navigate their city more safely and provide law enforcement with a mirror of their own operational impact.