
Beyond the Glass Ceiling: Mapping the Global Network of Women Directors
Beyond Fortune 500: Women in a Global Network of Directors
This study presents a large-scale social network analysis of approximately 320,000 board members across 36,000 companies worldwide using Financial Times data. It utilizes bipartite graph projections and centrality metrics to evaluate the structural positions of women in the global network of "interlocking directorates."
TL;DR
Is the corporate world still an "old-boys club"? While the numbers suggest a significant gender gap (women hold only ~13% of seats), this massive network study of 321,967 directors reveals a surprising reality. Using social network analysis (SNA), researchers found that women are actually more central and better connected than their male counterparts once they reach the boardroom, effectively debunking long-standing myths about "queen bees" and "tokenism."
The "Broken" Boardroom: Motivation and Myths
For decades, the narrative surrounding women in leadership has focused on two negative tropes:
- The Token Woman: The idea that companies hire exactly one woman to satisfy diversity requirements and silence critics.
- The Queen Bee: The theory that women who achieve high-level success actively hinder the progress of other women to protect their unique status.
Previous studies often suffered from small sample sizes (e.g., focusing only on Fortune 500 firms). This paper seeks the truth by scaling up the analysis to a global level, covering 54 countries and tens of thousands of firms to see where women actually sit in the complex web of interlocking directorates.
Methodology: The Power of Interlocks
To quantify influence, the authors modeled the business world as a bipartite graph. In this setup, an edge connects a "Director" node to a "Company Board" node. When a director sits on multiple boards (an "interlock"), they create a bridge between organizations.
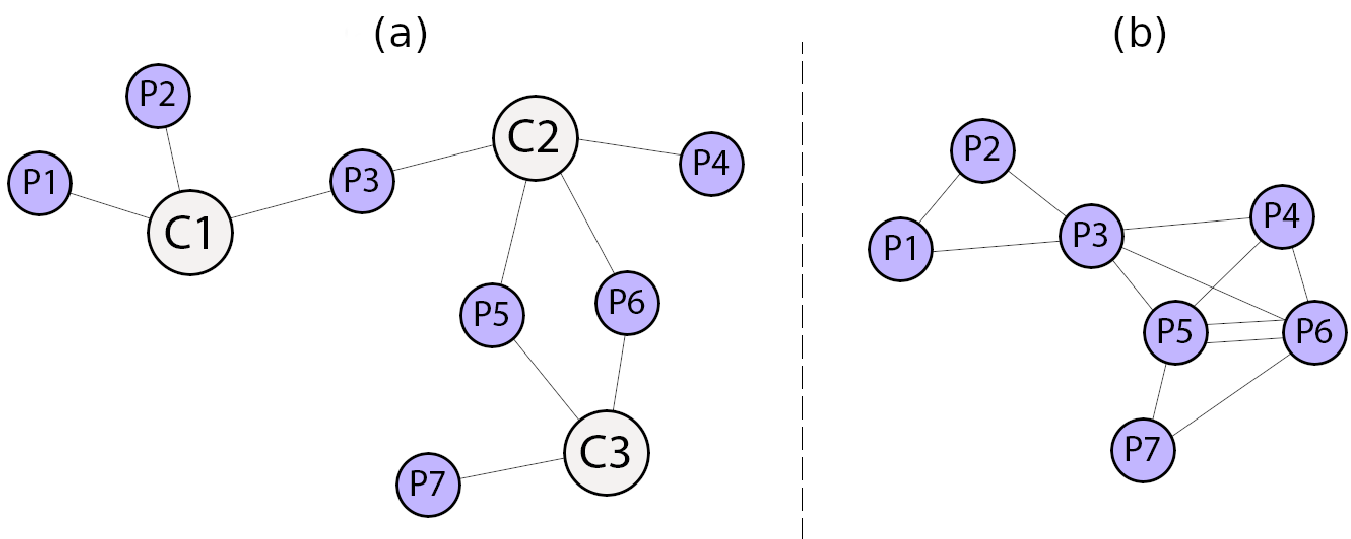
The researchers projected this into a one-mode network where nodes are directors and edges represent shared board memberships. They then analyzed:
- Degree Centrality: How many other directors a person is connected to.
- Betweenness Centrality: How often a director acts as a bridge between different parts of the network.
- Null Models: They compared actual board compositions against a probabilistic model where gender was assigned randomly to see if "clustering" or "tokenism" was the reality.
Key Insights: Breaking Myths with Data
1. Myths of Marginalization
The data shows that women are far from being "isolated." In fact, a higher percentage of women (79.4%) are part of the network's "Largest Component" compared to men (74.8%). This means women are structurally better positioned to access and spread information across the global corporate landscape.
2. The Death of the "Token Woman" Theory
If companies were just hiring "tokens," we would see a massive number of boards with exactly one woman. However, the study found that women are more clustered than a random distribution would predict.
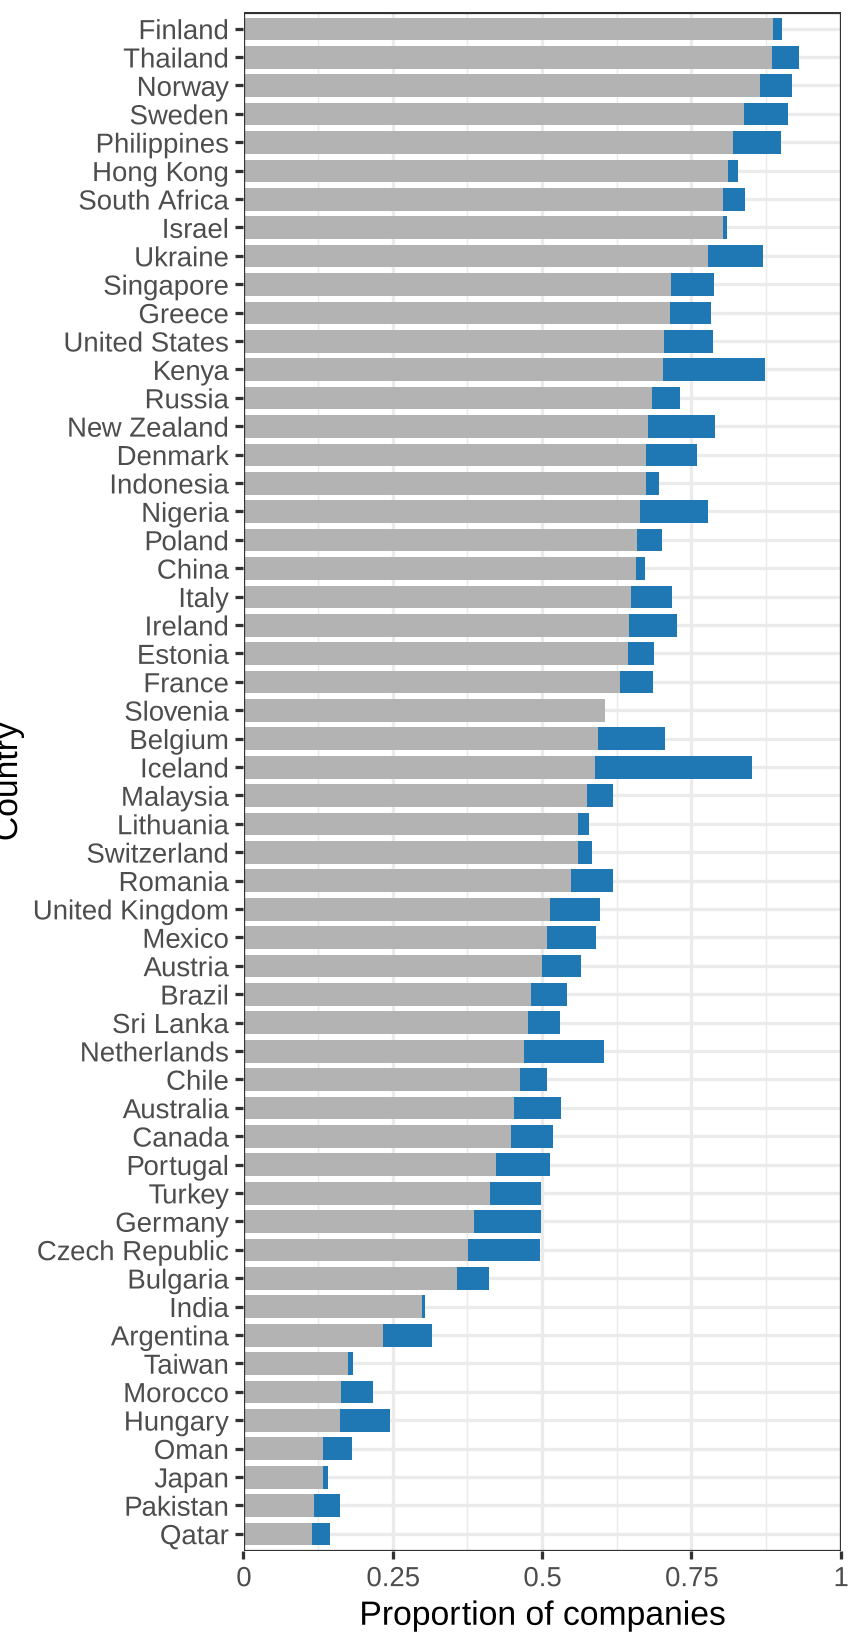 Fig: In nearly every country, the observed frequency of boards with at least one woman is actually lower than the null model, and specific clustering indicates that once a board starts diversifying, it often targets more than just one woman.
3. Centrality and Influence
The "influence gap" is narrower than the "representation gap." Women actually have a higher average degree (18.74 vs 16.68) and betweenness centrality than men.
| Metric | All Directors | Male | Female |
|---|---|---|---|
| Average Degree | 17.45 | 16.68 | 18.74 |
| % in Largest Component | 74.7% | 74.8% | 79.4% |
| Avg. Betweenness | 6.51e5 | 6.55e5 | 8.51e5 |
Source: Table 2 Summary Statistics. Women appear slightly more "connected" on average.
Conclusion and Global Outlook
The study provides a nuanced view: the "Glass Ceiling" is real (representation is still low at 9-13%), but there is no "Glass Cage." Once women break through, they are not sidelined.
However, there are stark geographical differences. While Scandinavian countries and, surprisingly, Ukraine and Thailand show higher female representation, countries like Japan (1.2%) remain extremely laggard. The research suggests that the path forward isn't just about fighting "queen bees"—who don't seem to exist in the data—but about addressing the structural barriers that prevent the first 10% of women from entering the network.
Future Outlook: While this study looked at the presence of links, future work should examine the strength and quality of these professional relationships to see if "influence" translates into "power."