
Beyond Volume: Deciphering User Behavior through the Lens of Big Data Utility
Big Data in Online Social Networks: User Interaction Analysis to Model User Behavior in Social Networks
The paper introduces a comprehensive framework for modeling user behavior in Online Social Networks (OSNs) through the lens of Big Data. It focuses on scalable, online techniques for Trend Analysis, Opinion Change detection, and Event Summarization, ultimately proposing a cost/utility evaluation framework for data acquisition.
Executive Summary
TL;DR: This paper moves beyond the "more is better" fallacy of Big Data, presenting a rigorous framework to model social interactions in real-time. By introducing GeoWatch for spatial-temporal trends and analyzing the mechanics of opinion change, the authors provide a scalable roadmap for extracting signal from the noise of hundreds of millions of daily interactions.
Background Positioning: This work serves as a foundational bridge between traditional Computational Social Science and modern Stream Processing. It challenges the SOTA by arguing that data value asymptotically diminishes, shifting the focus from data acquisition to data valuation and cost-effective modeling.
Problem & Motivation: The Paradox of Social Big Data
Social scientists previously lacked the scale to observe global phenomena in real-time. While OSNs (Facebook, Twitter, Renren) solve the scale problem, they introduce a new one: The Curse of Big Data.
- Spurious Correlations: With millions of variables, high correlations often occur by pure chance, leading to flawed predictive models.
- Noise vs. Signal: Critical events (like the 2008 Santa Barbara fires) are often buried under a localized or global hum of irrelevant chatter.
- The "Wisdom of Crowds" Trap: Relying indiscriminately on aggregate data can ignore the fact that specific, non-power users often hold the most valuable "breaking" information.
The authors' insight is that we need approximate, space-efficient algorithms that respect the temporal and spatial dimensions of data rather than viewing it as a static, homogeneous mass.
Methodology: GeoWatch and Multi-dimensional Sketches
The core technical contribution is the GeoWatch architecture, designed to solve the heavy-hitter problem across location-topic pairs.
1. Spatial-Temporal Trend Analysis
Unlike simple frequency counters, GeoWatch uses a Sketch-based structure to support both insertions and deletions in a sliding window. This allows for:
- Filtering Globality: Identifying topics that are trending because of a location, distinguishing them from globally popular topics that appear everywhere.
- Sliding Window Logic: Capturing "flash crowd" events that peak and dissipate quickly.
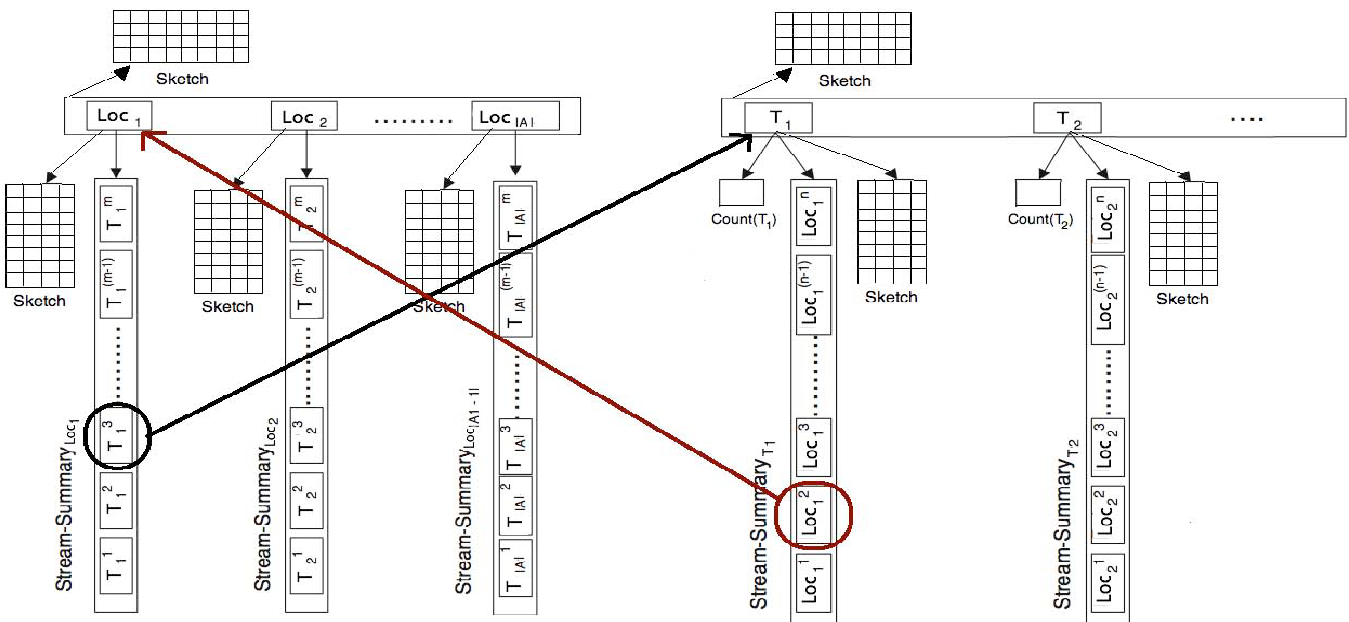 Figure 1: The proposed GeoWatch framework utilizing Location-StreamSummary tables and Topic-StreamSummary hash structures to maintain approximate counts in sub-linear space.
2. Opinion Change and Network Effects
To model persuasion, the authors combine Bayesian sentiment classifiers with social diffusion models (Voter Model, Independent Cascade). They specifically investigate whether a user's neighbor's opinions (e.g., choice of iPhone vs. Android) predict the user's future state.
Experiments & Results: When Big Data Fails
The authors tested their theories on several large-scale Twitter datasets:
- Emergency Detection: GeoWatch successfully mapped the 2011 Japan Earthquake, showing a distinct density increase in "tweets about Japan" compared to "tweets from Japan."
- The Mobile Preference Experiment: In a surprising turn, the authors found that social graph influence was not statistically significant for mobile device switches. Even with a complete dataset, the "signal" for why a user changed phones wasn't present in their online following patterns.
- Breaking News Efficiency: By treating users as "trending items," the framework can discover "one-time innovators"—ordinary users at the scene of an event whose reporting value temporarily exceeds that of major news agencies.
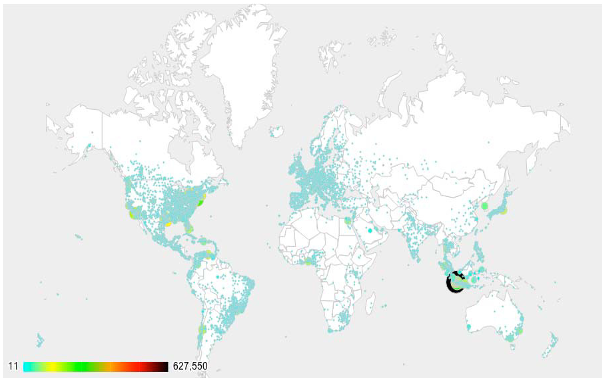 Figure 2: Heatmap comparison of (a) Tweets in Cities and (b) Tweets about Cities, illustrating how spatial awareness isolates event-driven trends (like the Japan Earthquake) from high-activity regions (like Indonesia).
Critical Analysis & Conclusion
The Takeaway
The true value of social Big Data lies in its Utility/Cost ratio. The paper concludes that for many social applications, "smart truncation"—reducing Big Data to high-quality "Small Data"—is mandatory for accuracy.
Limitations
A notable limitation is the reliance on implicit signals (like "Source" fields for device preference), which may not capture the full psychological complexity of human decision-making. Furthermore, the sketch-based methods, while efficient, inherently introduce approximation errors that might miss extremely niche but critical signals.
Future Outlook
The proposed Scoring Framework for Big Data points toward a future where data acquisition is an optimization problem: balancing the cost of storage and processing against the probabilistic value of the insights gained. This is a crucial pivot for any organization operating in the "highly unpredictable space of computational social science."