
Decoding BPD: Spectral Power of rs-fMRI as a New Frontier in Psychiatric Diagnosis
17747_Classification of borderline personality disorder based on spectral power of resting-state fMRI.
This paper presents a novel machine learning framework for the objective diagnosis of Borderline Personality Disorder (BPD) using spectral power features from resting-state fMRI (rs-fMRI). By analyzing 20 brain regions across 5 frequency bands, the proposed method achieves a state-of-the-art accuracy of 93.55% using a Gaussian Mixture Model (GMM) classifier.
TL;DR
Diagnosing Borderline Personality Disorder (BPD) has long been a subjective endeavor. This study changes the game by introducing a machine learning framework that analyzes the "rhythm" of the brain—specifically the spectral power of resting-state fMRI. By focusing on specific frequency bands and brain regions, the model achieves a remarkable 93.55% accuracy, providing a potential objective "blood test" equivalent for mental health.
Contextual Positioning
Within the landscape of neuroimaging, most studies focus on structural volume or simple functional connectivity. This work positions itself as a specialized technical advancement by combining spatial localization with spectral depth, utilizing classical signal processing (Welch method) and robust statistical modeling (GMM) to bridge the gap between raw fMRI data and clinical utility.
The Core Motivation: Moving Beyond Subjectivity
The primary roadblock in treating BPD is the lack of objective biomarkers. Clinical assessments are susceptible to bias and patient reporting errors. While previous attempts used structural MRI (achieving ~80% accuracy), they failed to capture the dynamic, functional abnormalities inherent in BPD. The authors hypothesized that the power distribution across different frequency oscillations in the brain holds the key to identifying the disorder.
Methodology: The Spectral-Spatial Lens
The authors didn't just look at where the brain was active, but how it oscillated.
- Feature Extraction: They calculated PSD (individual region strength) and CPSD (shared strength between pairs) across 20 ROIs and 5 frequency bands.
- mRMR Selection: To prevent the "curse of dimensionality," they used Minimum Redundancy Maximum Relevance to pick only the most "informative" features.
- Classification: A Gaussian Mixture Model (GMM) was used to learn the probabilistic distribution of "Health" vs. "BPD."
 Figure 1: The systematic pipeline from fMRI pre-processing to GMM classification.
Key Insights from Experimental Results
The results provide a striking map of the BPD brain. The most discriminative activity occurred in the 0.1~0.15Hz (B3) band.
- The "Where": Significant differences were found in the bilateral thalamus, left medial orbitofrontal cortex (OFC), and right rostral ACC.
- The "How": Patients showed increased energy in the left medial OFC but decreased energy in the left thalamus compared to healthy controls.
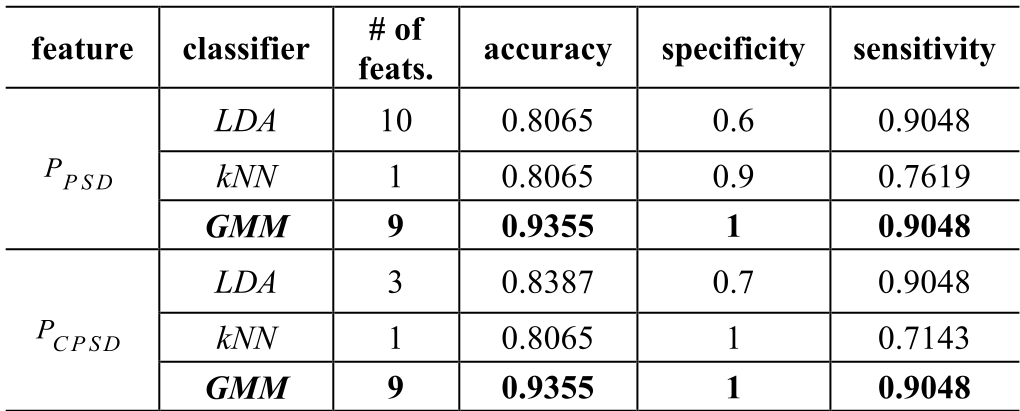 Table 1: GMM outperformed traditional LDA and kNN, highlighting the non-linear complexity of BPD signatures.
Critical Analysis & Future Outlook
While the 93.55% accuracy is impressive, the study faces a common neuroimaging challenge: Sample Size (n=31). The results are a "proof of concept" rather than a final clinical tool.
The selection of the 0.1-0.15Hz band is particularly interesting, as it falls slightly higher than the traditional low-frequency fluctuations (0.01-0.1Hz) typically studied in fMRI, suggesting that BPD may be characterized by subtle, faster neural oscillations that common filters might miss.
Conclusion
This work demonstrates that BPD is not just a "behavioral" issue but has a distinct spectral fingerprint in the brain. By leveraging machine learning to synthesize spectral and spatial data, we are moving closer to a future where psychiatric diagnosis is guided by quantitative, biological evidence.