
Bots in Nets: How 0.28% of Users Dominate the Global Narrative
Bots in Nets: Empirical Comparative Analysis of Bot Evidence in Social Networks
This paper presents a comparative empirical analysis of social bot behavior across three major 2016 global events: the U.S. Election, the Ukraine Conflict, and Turkish Political Censorship. Using the DeBot detection platform and Social Network Analysis (SNA), the authors reveal that a tiny fraction of users (0.28%) can dominate network influence, with individual bots ranking in the top 10 for centrality among millions of users.
TL;DR
In a massive empirical study of 30 million tweets covering the 2016 U.S. Election, the Ukraine Conflict, and Turkish Censorship, researchers discovered a startling reality: Social bots, despite making up less than 1% of the user base, occupy nearly half of the most influential positions in online discourse. By strategically embedding themselves into high-value network positions, these "digital gatekeepers" exert influence that far outweighs their numbers.
Background: The Evolution of Digital Gatekeeping
The reliance on Online Social Networks (OSNs) for news has created a playground for automated manipulation. While we often think of bots as "spam bots" flooding our feeds with repetitive content, this paper shifts the focus toward structural influence. The researchers ask: Where do bots sit in the social graph, and does their position allow them to control the flow of information?
Methodology: Mapping the Invisible Influence
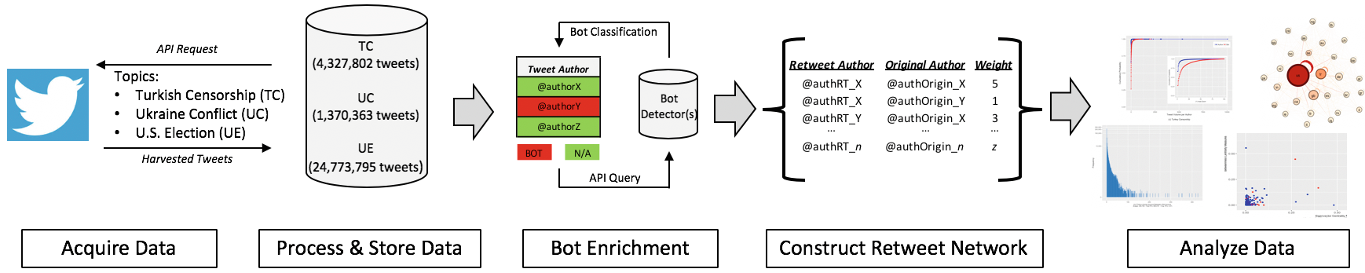
The study employs a robust framework to process data from three geopolitical flashpoints. They used DeBot, a tool that detects bots based on "warped correlation" (identifying accounts that tweet in a suspiciously synchronized manner) rather than simple feature extraction.
1. The Retweet Network
The researchers constructed directed graphs where an edge represents a "Retweet." This structure is the "skeleton" of information flow.
- Nodes: 2.8 million+
- Edges: 11.7 million+
2. Centrality Measures
To find the "VIPs" of the network, the study used three metrics:
- Degree Centrality: Number of direct connections (Popularity).
- Eigenvector Centrality: Influence based on being connected to other influential people (Network Influence).
- Betweenness Centrality: Acting as a bridge between different groups (Information Flow).
Key Insights: Influence vs. Popularity
The most profound finding is the "Influence Gap." In traditional social theory, we assume that more followers equal more influence. The data from the Ukraine Conflict tells a different story.
The Outlier Strategy: In the Ukraine data, many bots showed low Degree Centrality (they weren't "popular") but extremely high Eigenvector Centrality. By following and being retweeted by a few key influencers, these bots "infiltrated" the conversation without drawing the attention that comes with a massive follower count.
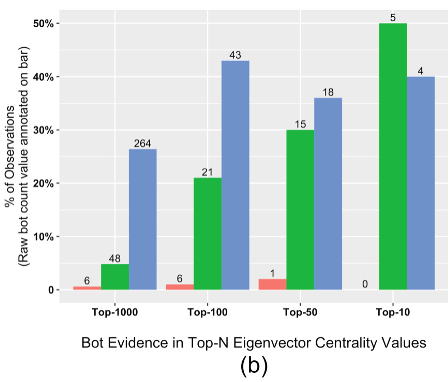
As shown in the charts above, bots (represented in different colors for each event) consistently punch above their weight class in the Top-10 and Top-100 centrality rankings. In the U.S. election, bots accounted for 43% of the top 100 influencers.
Community Infiltration
Using the Louvain Method, the authors analyzed how bots distribute themselves. They found that bots are not just talking to each other (in-group communication). Instead, they are deeply embedded within human communities (cross-group communication).
| Event | Bot Count in Top Communities | Bot Density vs. Human |
|---|---|---|
| U.S. Election | 71.2% in Top 5 groups | High cross-group engagement |
| Ukraine | 75.9% in Top 5 groups | Strategic clustering |
Conclusions & Future Risks
This paper serves as a warning for the "Science of Fake News." It proves that bot detection cannot rely on volume alone. High-sophistication bots act as "nodes of influence" that bridge gaps between communities, allowing them to inject narratives into the mainstream human discourse with surgical precision.
Limitations: The study is restricted to Twitter (X) and data from 2016. However, the methodology provides a blueprint for auditing modern LLM-powered bots, which are likely even more adept at mimicking human interaction and securing central network positions.
Theoretical Takeaway
Influence in a network is not driven by popularity. For those looking to defend the integrity of online discourse, the front line is no longer just "deleting spam"—it is identifying the structural nodes that control the narrative.