
Mapping the Digital Flow: Uncovering User Behavior Through Wi-Fi Community Detection
Browsing Behavior Analysis from Wi-Fi Logs Based on Community Detection: Case Study on Educational Institution
This study presents a framework for analyzing user browsing behavior by applying community detection to Wi-Fi logs from an educational institution. The authors transform 13.2 GB of raw logs into a directed, weighted graph and compare the Girvan-Newman and Infomap algorithms, finding that Infomap achieves higher modularity and significantly faster execution.
TL;DR
By treating website transitions as a complex network rather than independent data points, researchers from Universitas Indonesia have unlocked a way to "map" browsing behaviors. Using the Infomap algorithm, they successfully categorized 13.2 GB of Wi-Fi logs into functional communities—revealing not just educational usage, but also hidden clusters of malware activity—all while proving that information-flow models are thousands of times faster than traditional edge-betweenness methods.
Problem & Motivation: Beyond Simple Statistics
Network administrators typically look at what is being accessed and when. However, the how—the sequence and relationship between sites—is often neglected. Traditional clustering (like K-Means) treats every website visit as a discrete attribute, ignoring the rich structural information inherent in a user's journey from one domain to another.
The challenge lies in the scale and nature of the data:
- Directionality: Browsing is a one-way path (Node A to Node B), requiring directed graph analysis.
- Computational Complexity: Real-world Wi-Fi logs generate millions of edges, making many traditional graph algorithms (like Girvan-Newman) computationally prohibitive.
Methodology: Networks as Information Flow
The researchers transformed raw logs into a Directed Weighted Graph.
- Nodes: Domain-level URLs (e.g.,
google.com). - Edges: Transitions between domains by the same user.
- Weights: Frequency of these transitions.
The core of the study compares two heavyweights in graph theory:
- Girvan-Newman (GN): A divisive algorithm that iteratively removes "high-betweenness" edges to break the network into clusters.
- Infomap: A more modern approach that views the graph as a communication system. It uses a Random Walker to simulate movement across the network and applies the Map Equation to find a partition that minimizes the description length of the walker's path.
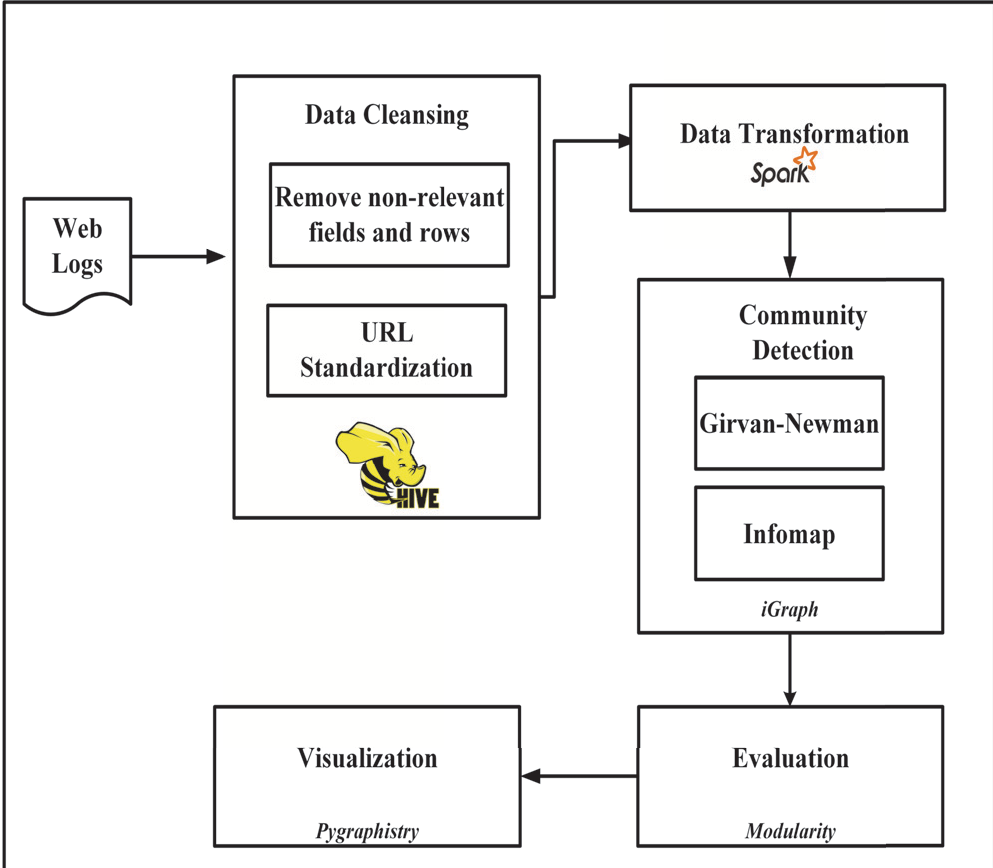 Figure 1: The standard workflow from raw Wi-Fi logs to visualized communities.
Experiments & Results: The Performance Gap
The experiment utilized a Hadoop/Spark cluster for pre-processing and iGraph for the core detection. The results were stark:
- Speed: For the full dataset (160k+ edges), Girvan-Newman took a staggering 6 days. Infomap completed the same task in 27.5 seconds.
- Quality (Modularity): Infomap consistently achieved higher Modularity () scores. In graph theory, a higher indicates a "stronger" community structure where internal links far outnumber external ones.
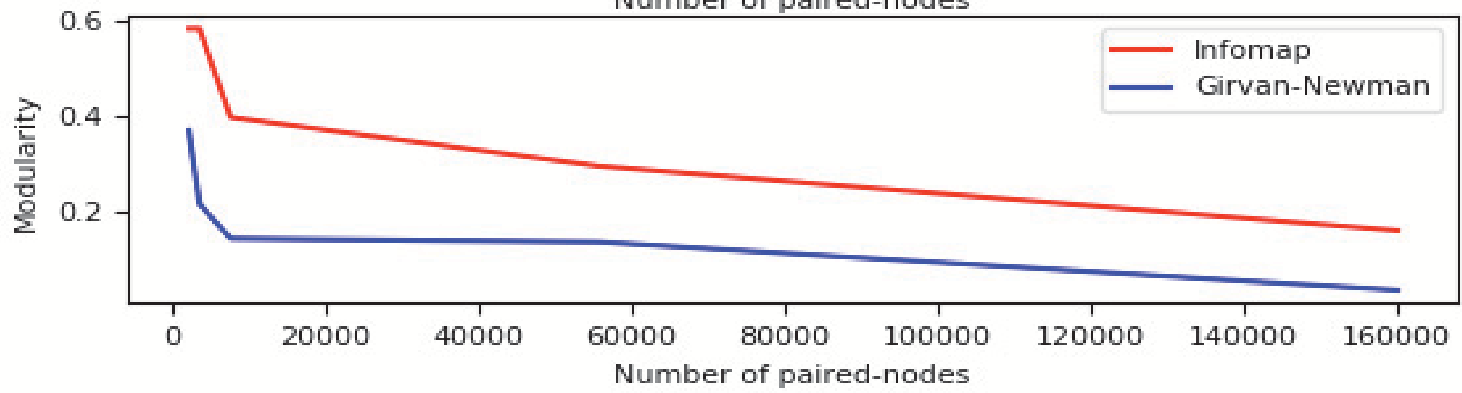 Figure 2: Time execution and Modularity comparison. Note the exponential rise in GN execution time (top-left).
Qualitative Insights
Beyond the math, the visualization (using PyGraphistry) revealed the "DNA" of the institution's internet usage. The authors identified:
- Community 0: A heterogeneous mix of education and entertainment.
- Community 5: A dedicated cluster of Malware domains, providing a clear target for network security filters.
- Government Clusters: Distinct communities for both US and Indonesian government sites, reflecting specific research or administrative behaviors.
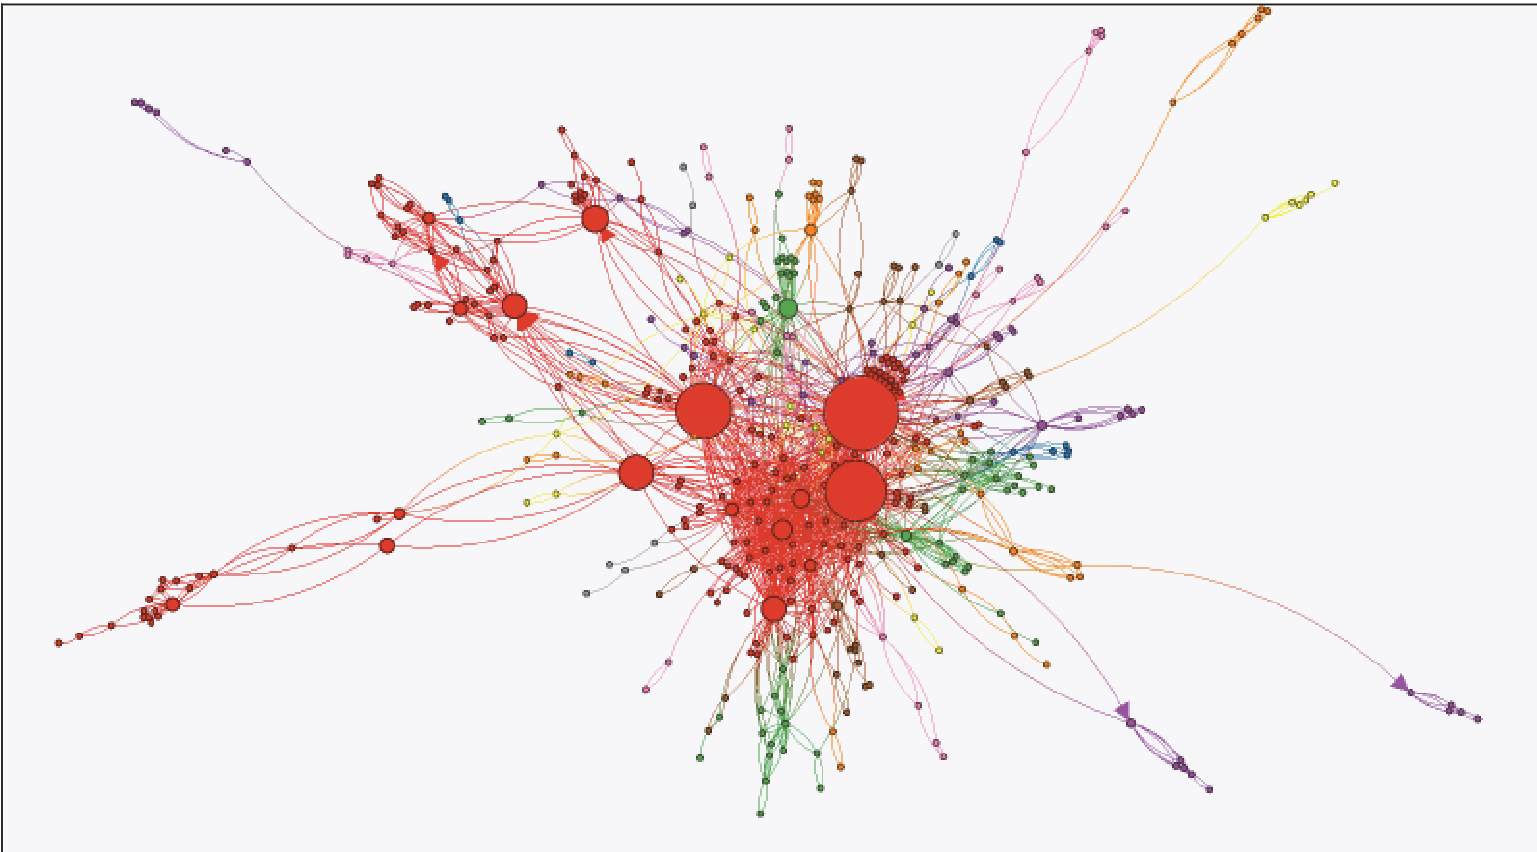 Figure 3: Visualization of the 190 discovered communities, where node size represents the connection degree.
Critical Analysis & Conclusion
The value of this study lies in its shift from content-based analysis to structure-based analysis. By identifying a "Malware Community," admins can block entire clusters of related domains even if a specific URL hasn't been flagged yet.
Limitations: The study uses a static snapshot of nine days. Browsing behavior is highly temporal (exam seasons vs. holidays), and the current model doesn't account for how these communities evolve over time.
Takeaway: For large-scale network forensics, Infomap is the clear winner. Its ability to treat the network as a map of information flow allows for near-real-time community detection that edge-based algorithms simply cannot match. Future research into "Dynamic Community Detection" could allow these insights to be generated live, stopping cyber-threats the moment a "malicious community" begins to form.