
The Hidden Map of Science: Building a Social Network of Acknowledgments
Towards Building and Analyzing a Social Network of Acknowledgments in Scientific and Academic Documents
This paper introduces the first large-scale construction and analysis of a "Social Network of Acknowledgments" in scientific literature. Leveraging the CiteSeerX repository, the authors develop an automated pipeline using regular expressions and Named Entity Recognition (NER) to map the hidden influence of individuals and funding organizations that contribute to research beyond formal co-authorship.
TL;DR
While we often measure scientific success through citations and co-authorship, a massive layer of academic influence remains hidden in the "Acknowledgments" section. This paper presents the first systematic attempt to extract and analyze this network at scale, revealing a power-law distributed world where funding agencies like the NSF and prolific "super-peers" like Oded Goldreich act as the central hubs of scientific progress.
Problem & Motivation: Beyond the Author List
In the sociology of science, the author list is only the tip of the iceberg. Below the surface lies a complex web of "sub-authorship": the colleague who suggested a crucial proof, the peer who reviewed a draft, and the agency that provided the millions in funding.
Historically, these have been called "super-citations." However, before this study, analyzing them was a manual, painstaking process limited to small journal samples. The authors argue that without mapping acknowledgments, our understanding of the scientific social graph is incomplete. We are tracking who works together, but not who helps whom.
Methodology: Mining Gratitude
The researchers built an automated pipeline to process the CiteSeerX repository (1.5M+ documents). The workflow consisted of two critical technical hurdles:
- Section Extraction: Identifying where the acknowledgments start and end is surprisingly difficult due to varying formats (especially in books). The team used a regex-based approach that achieved an impressive 91.9% F1-measure.
- Entity Disambiguation: They utilized industrial-strength NER services (OpenCalais and AlchemyAPI) to distinguish between people, companies, and organizations.
The Social Graph Architecture
The resulting graph is directed and heterogeneous. An edge exists if author thanks entity . Unlike co-authorship (which is undirected), this captures the "flow of influence."
Note: The paper utilizes a combination of regex for sectioning and API-based NER for entity classification.
Critical Results: Who Rules the Network?
The study analyzed a representative subset of the top 1000 cited papers, resulting in a graph of 5,983 nodes and 17,287 edges.
1. The Dominance of Funding
Unsurprisingly, major organizations dominate the in-degree (number of times thanked). The National Science Foundation (NSF) stands as the undisputed titan of the network.
| Entity | Number of Acknowledgments |
|---|---|
| National Science Foundation | 67,659 |
| NASA | 12,540 |
| IBM | 9,644 |
| DARPA | 8,976 |
2. The Relationship with H-Index
The authors observed a fascinating correlation: the most acknowledged persons (e.g., Oded Goldreich, David Wagner) also tend to have very high h-indices. This suggests that "being a good academic citizen"—providing feedback and discussions—is highly correlated with being a high-impact researcher.
3. Network Topology
The network exhibits a power-law distribution for degrees, a hallmark of "scale-free" networks where a few hubs connect the entire community. However, the Clustering Coefficient (0.103) is significantly lower than in co-authorship networks. This makes sense: you might thank the same funding agency as a colleague, but that doesn't mean your research "inner circles" overlap.
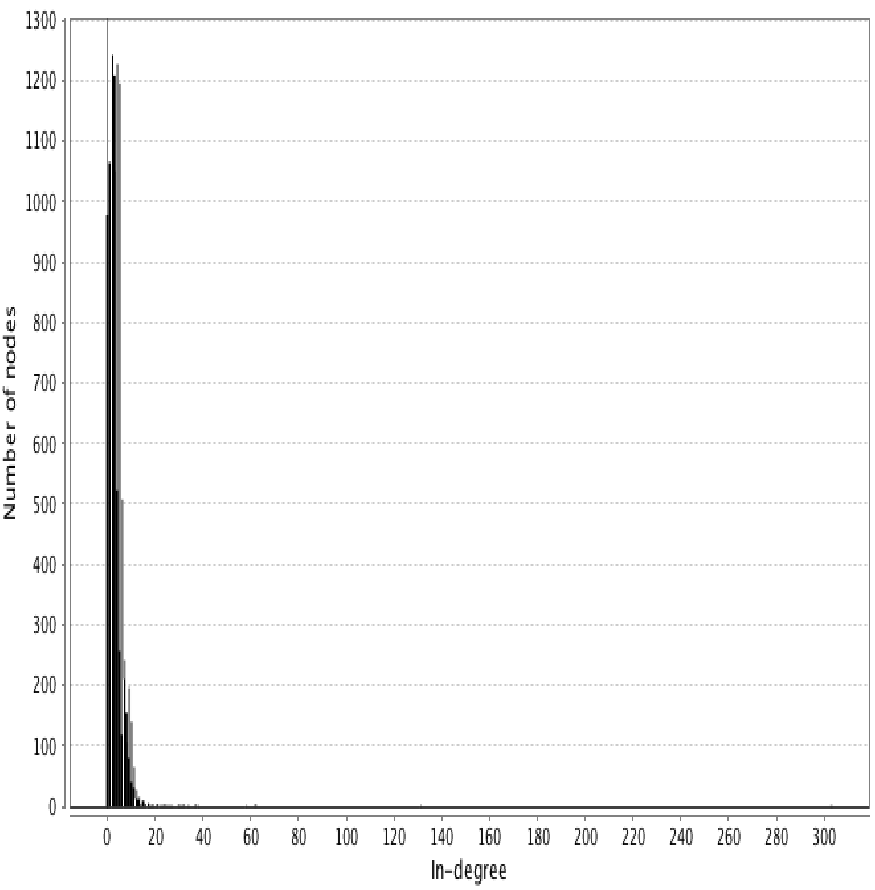 Fig 1: The In-degree distribution follows a power law, indicating the presence of major 'hubs' of influence.
Experimental Evidence
The F1 performance of the extraction varied depending on the document type:
- Papers only: ~98% F1 (Highly structured)
- Mixed (including books): ~91% F1 (More noise in formatting)
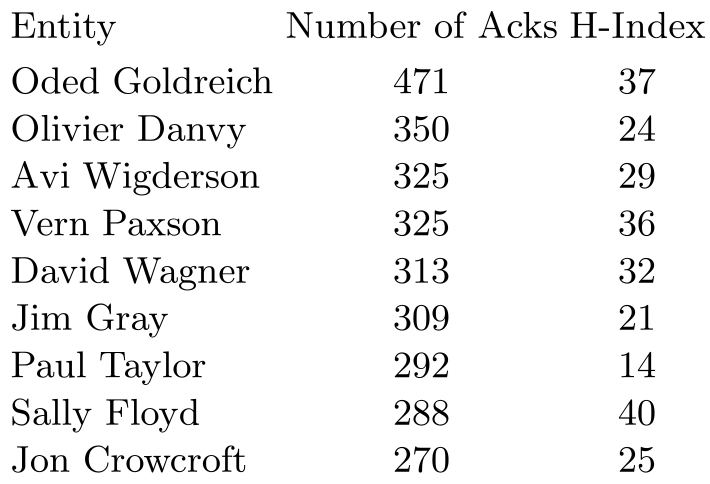 Fig 2: Top acknowledged individuals often serve as critical nodes in the knowledge dissemination process.
Critical Analysis & Conclusion
Takeaway: This work shifts the focus of bibliometrics from "Final Products" (Papers) to "Process Support" (Acknowledgments). It provides a quantitative framework to prove that science is a collective endeavor fueled by a small set of highly supportive individuals and agencies.
Limitations:
- Disambiguation: The system still struggles with entity resolution (e.g., treating "NSF" and "National Science Foundation" as separate nodes).
- Edge Weighting: Currently, a "thank you" for a $1M grant is treated the same as a "thank you" for a 5-minute conversation.
Future Work: The next frontier involves Sentiment Analysis of the acknowledgments—categorizing why people are being thanked—to distinguish between financial, technical, and moral support.
Senior Editor's Note: This paper is a foundational step in "Science of Science" (SciSci). By turning the 'back-matter' of papers into a queryable graph, it allows us to finally track the invisible labor that powers global R&D.