
Sensing the Tropics: How SAR and Temperature Decode Asparagus Growth
Using C-Band SAR and Temperature to Monitor Tropical Agricultural Fields
This paper presents a novel methodology for monitoring asparagus crops in tropical regions using Sentinel-1 C-band SAR data and ground-based temperature measurements. By leveraging a multi-output Random Forest regressor, the authors successfully estimate the number of stems across five phenological stages, achieving a high coefficient of determination (R² > 0.85).
TL;DR
Monitoring agriculture in the tropics is a "cloudy" challenge that optical satellites can't solve. This research introduces a robust framework using Sentinel-1 SAR (Radar) and ground temperature to track asparagus development in Peru. By treating crop growth as a multi-task learning problem, the authors can estimate the density of stems at various growth stages with over 85% accuracy, even when traditional seasonal markers are absent.
Background: The "Soft Seasonality" Problem
In temperate zones, winter stops growth. In the tropics, like the coastal zones of Peru, asparagus grows year-round. This leads to "soft seasonality" where different parcels are at different growth stages simultaneously. Furthermore, heavy cloud cover makes optical sensors (like Sentinel-2) unreliable. This study identifies Synthetic Aperture Radar (SAR) as the solution, but with a twist: the radar signal alone isn't enough to distinguish between a "fast-growing" summer crop and a "slow-growing" winter one.
Motivation: Why Backscatter Isn't Enough
As asparagus grows, its physical structure changes from vertical spears (causing double-bounce scattering) to a dense, leafy fern (causing volume scattering). However, temperature significantly influences:
- Canopy Volume: Higher temperatures often lead to less biomass.
- Growth Rate: Summer campaigns develop faster.
- Season Length: Driven by accumulated heat.
Without accounting for temperature, a single SAR "snapshot" is ambiguous. The researchers realized that to truly "see" the crop, they needed to combine the physical silhouette provided by SAR with the biological clock provided by temperature.
Methodology: Multi-Output Intelligence
The core of the approach is a Multi-output Random Forest Regressor. Unlike standard regression, this model understands that "Emergence," "Ramification," and "Maturation" are not independent variables—they are stages of a single biological process.
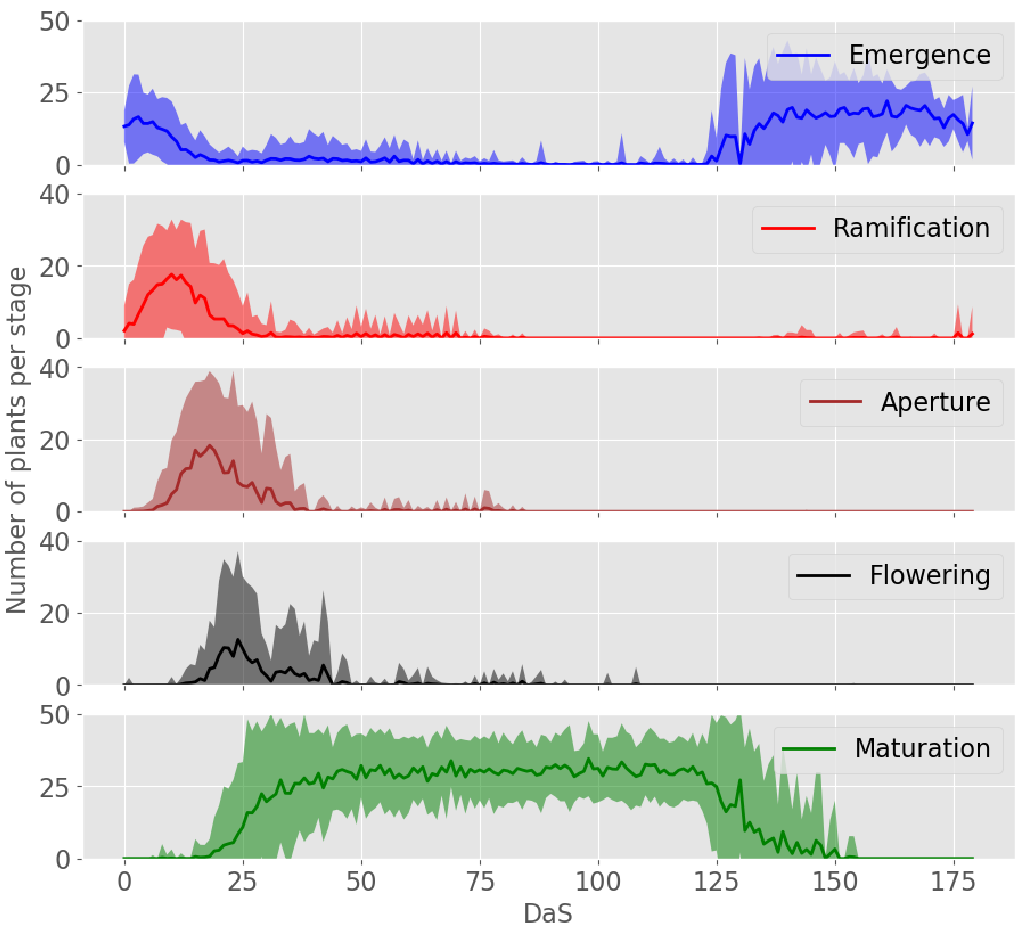 Fig 1: The synchronized evolution of different asparagus phenological stages over time.
The Experiment Scenarios:
- Scenario A: Temperature + Days since start (No Radar).
- Scenario B: Single SAR image (VH, VV polarizations).
- Scenario C: SAR + Temperature (The Hybrid Approach).
Results: The Power of Data Fusion
The results (Table 1) are telling. Using only a single SAR acquisition (Scenario B) yielded a dismal R² of 0.31. However, when SAR was combined with temperature (Scenario C), the accuracy soared to 0.86.
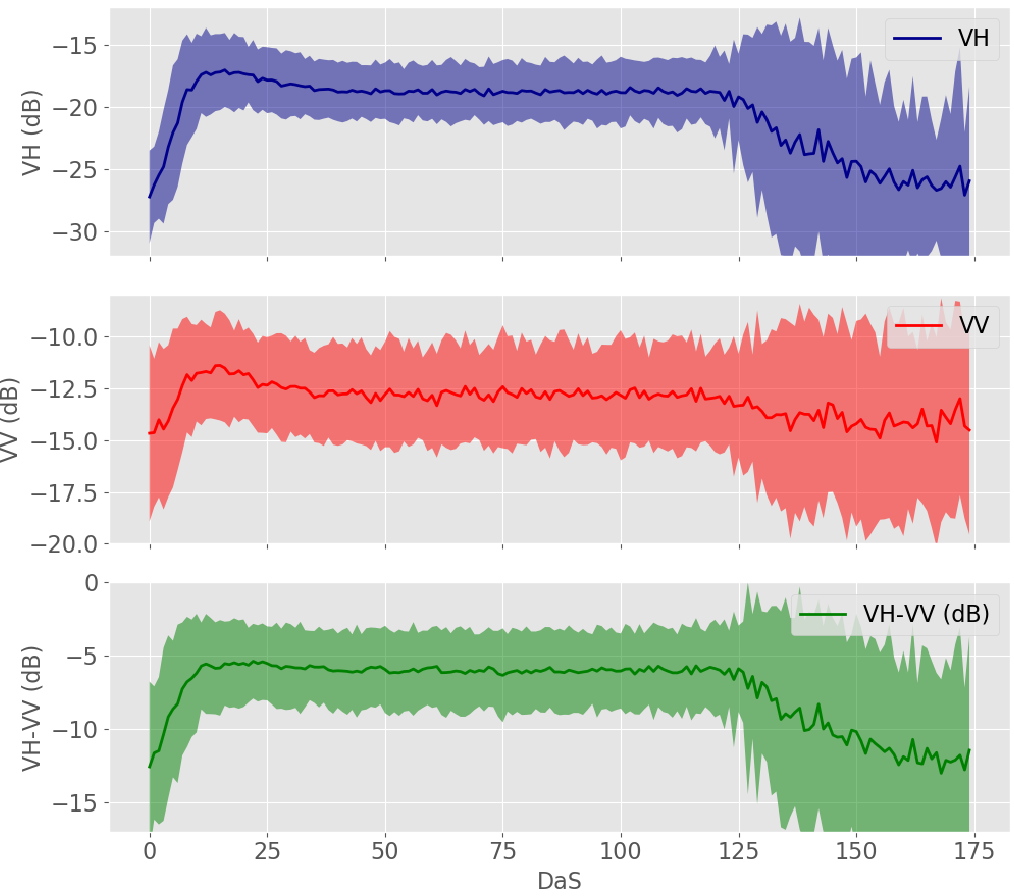 Fig 2: Sentinel-1 backscatter response. Notice the peak during the 'aperture' stage where structure complexity is highest.
The model was particularly adept at identifying the Maturation stage (R² = 0.93), which is crucial for farmers planning their harvest and logistics.
Critical Insight & Future Outlook
This paper proves that biophysical context matters. In remote sensing, we often try to force "pixels" to tell the whole story, but in the tropics, the "weather" is an inseparable part of the pixel's meaning.
Takeaway for the Industry:
- SAR is the backbone: Its ability to penetrate clouds is non-negotiable for tropical AgTech.
- Hybrid Models are the Future: Combining satellite data with IoT ground sensors (temperature) provides a level of detail that neither can achieve alone.
- Next Steps: The authors are currently investigating if multitemporal SAR (looking at sequences of images over time) can eventually "learn" the growth rates well enough to eliminate the need for ground-based temperature sensors entirely.
Conclusion
By mapping the "invisible" growth of asparagus through clouds and heat, this study sets a new standard for precision agriculture in some of the world's most productive—yet difficult to monitor—environments.
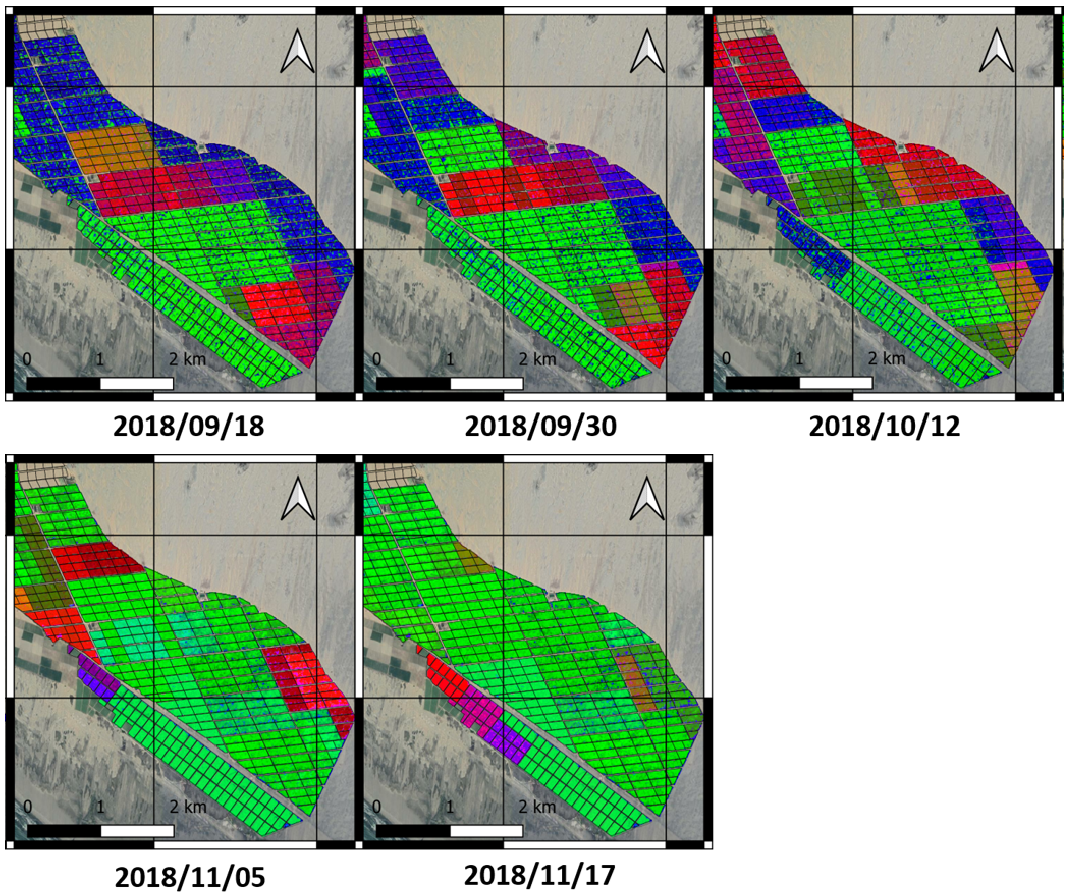 Fig 4: Visualizing the numbers: The model's ability to map stem counts across thousands of parcels simultaneously.