
Can Twitter Save Lives? Bridging the Gap in Social Media Analytics for Crisis Intelligence
Can twitter really save your life? A case study of visual social media analytics for situation awareness
The paper presents a comprehensive case study evaluating ScatterBlogs, a visual analytics framework for real-time social media monitoring in crisis management. By engaging 29 domain experts through tasks based on the 2013 German Flood, the study bridges the gap between theoretical visual analytics and practical situation awareness (SA).
TL;DR
This paper evaluates ScatterBlogs, an integrated visual analytics (VA) platform, through a large-scale case study involving 29 experts from disaster response and critical infrastructure management. Using real data from the 2013 German Flood, the study validates how a combination of spatiotemporal clustering, machine learning classifiers, and interactive maps can transform chaotic social media streams into actionable Situation Awareness (SA).
The Gap: From Technical Feasibility to Operational Reality
For years, researchers have touted Twitter as a "distributed sensor network" for disasters. However, a significant disconnect has persisted: most tools were built in academic silos, tested on historical data by researchers rather than the first responders who actually need them. This paper addresses the "so what?" of social media analytics—moving from "we can visualize this" to "experts can actually use this to make decisions."
The authors identify that for professional environments (like power grid management or federal disaster agencies), the volume of data is less of a problem than the signal-to-noise ratio and the trustworthiness of the information.
Methodology: The ScatterBlogs Ecosystem
The authors don't just present one algorithm; they present a multi-tool approach. The ScatterBlogs platform acts as a reference implementation for several high-level analytical patterns:
- TagMaps (Automatic Event Detection): Uses spatiotemporal clustering to find groups of messages that are close in both time and space and share a topic.
- Content Lenses: A focus+context technique that generates dynamic tag clouds as the user moves a "lens" across a map, utilizing a geospatial version of tf-idf.
- SVM Classifiers: Pre-trained supervised learning models that filter the stream for specific high-value events (e.g., "dike breach" or "power outage"), allowing analysts to prioritize recall over precision where necessary.
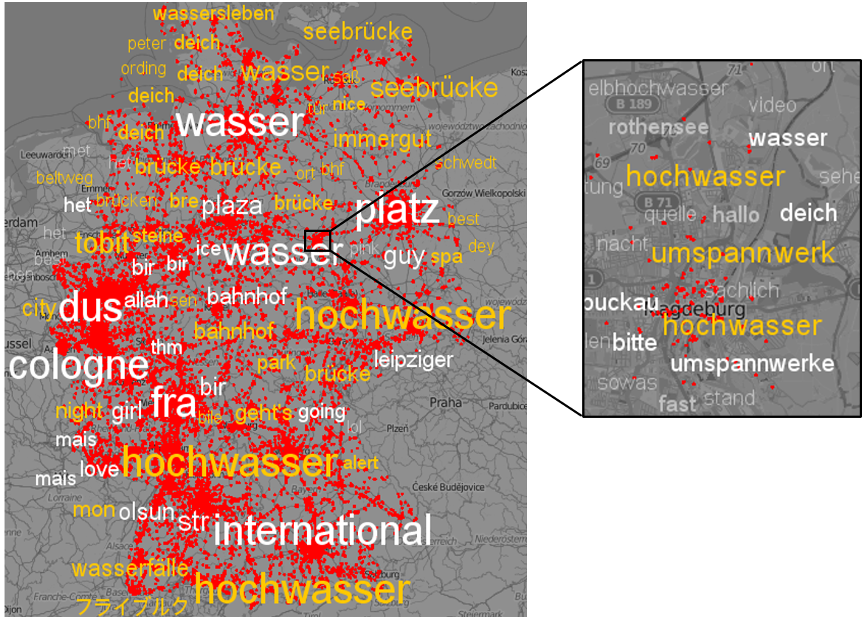 Figure 1: The UI integrates a hierarchical time overview, interactive maps with TagMap overlays (right), and LDA topic models to help analysts pivot from global trends to local sub-events.
Experimental Insights: Testing on the 2013 German Flood
The study utilized 29 experts from organizations like Siemens, Deutsche Bahn, and the German Federal Office of Civil Protection. They were tasked with finding specific events, such as a submerged transformer station in Magdeburg or a police-involved protest in Frankfurt.
Key Findings:
- Real-time Value: Experts were highly impressed by the speed of information. In several cases, social media reports reached them faster than official administrative reporting channels.
- The "Clutter" Problem: While tools like the TagMap were useful, experts found the visual density overwhelming. This suggests that color-coding alone isn't enough to manage visual cognitive load in high-stress environments.
- Visual Evidence: Responders overwhelmingly requested more integration of images and videos, noting that a photo of a broken dike is worth more than a thousand tweets for "verifying" the severity of a situation.
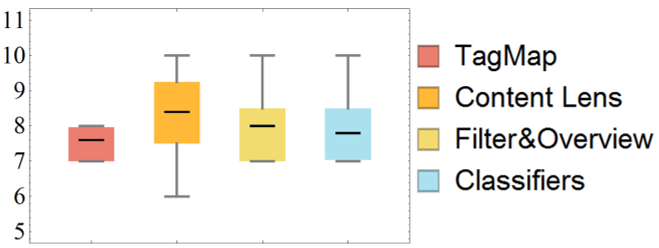 Figure 2: Ratings across most tool categories skewed high (7-9 range), though the learning curve for "Event Detection" was slightly steeper than for simple keyword searches.
Critical Analysis: What’s Missing for the Future?
While the study proves that visual analytics can significantly improve SA, it highlights three major barriers to widespread adoption:
- Standardization: To be adopted, these tools must speak the "language" of the domain—using tactical icons (like those used in NATO or national emergency standards) rather than generic dots.
- The Credibility Crisis: Automated tools for credibility analysis (checking user history, bot status, and cross-platform consistency) are no longer "nice-to-haves"—they are requirements for decision-making under risk.
- Privacy by Design: Analyzing public social media data during crises raises legal and ethical questions that future tools must solve through data aggregation rather than individual tracking.
Conclusion
The verdict is clear: social media can save lives, but only if the analytics interface acts as a partner to the human expert, rather than just a complex data dump. The transition from "interesting research" to "standard operations" is dependent on moving toward human-centered, trust-focused visualization designs.
Future Work Perspective: This paper sets a high bar for evaluating VA systems. The next frontier will likely involve Multi-Modal Situational Awareness, where text, imagery, and official sensor data (IoT) are fused into a single unified truth for responders.