
[arXiv 2024] Capability Salience Vector: Solving the "Loss-Performance Gap" in LLM Scaling Laws
Capability Salience Vector: Fine-grained Alignment of Loss and Capabilities for Downstream Task Scaling Law
The paper introduces the Capability Salience Vector (CSV), a novel method for fine-grained alignment between validation loss and downstream task performance. By assigning importance weights to specific tokens, CSV bridges the gap between raw cross-entropy loss and specific meta-capabilities (e.g., reasoning, mathematics), enabling accurate scaling law predictions across different data distributions and model families.
TL;DR
Standard scaling laws tell us how loss drops with more compute, but they are notoriously bad at telling us when a model will actually get better at math or reasoning. This paper introduces the Capability Salience Vector (CSV), which learns to weigh tokens differently based on their contribution to specific downstream tasks. The result? A scaling law that predicts benchmark accuracy with extreme precision (MSE ~1e-4), even across different model families and shifting data distributions.
The Problem: Why Validation Loss Lies to Us
We’ve all seen it: Model A and Model B have the same validation loss, yet Model B crushes Model A on the GSM8K math benchmark.
The authors identify two fatal flaws in current scaling law research:
- Compute is not a proxy for skill: If you change the data distribution (e.g., more code, less web text), the same amount of FLOPs leads to wildly different downstream results.
- The "Equal Weighting" Myth: Standard cross-entropy loss treats the prediction of a comma the same as the prediction of a complex logical step. In reality, downstream skills are tied to specific "meta-capabilities" that only certain tokens reflect.
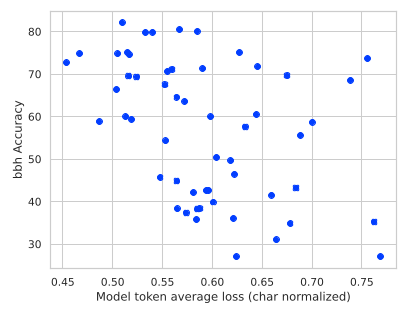 Figure 1: Traditional average token loss fails to provide a clear, monotonic relationship with downstream performance across different tasks.
Methodology: The Capability Salience Vector (CSV)
Instead of calculating a simple average loss, the authors define a capability score as a weighted sum of token-level losses:
How do we find the weights ?
The authors use a three-step optimization loop:
- Scoring: A small "scoring head" (using InternLM-1.8B as a backbone) assigns a salience weight to every token in a mixed validation set.
- Fitting: A sigmoidal function is used to map these weighted scores to actual benchmark accuracies.
- Optimization: The weights are adjusted via SGD to minimize the error between the predicted accuracy and the ground truth accuracy of known open-source models.
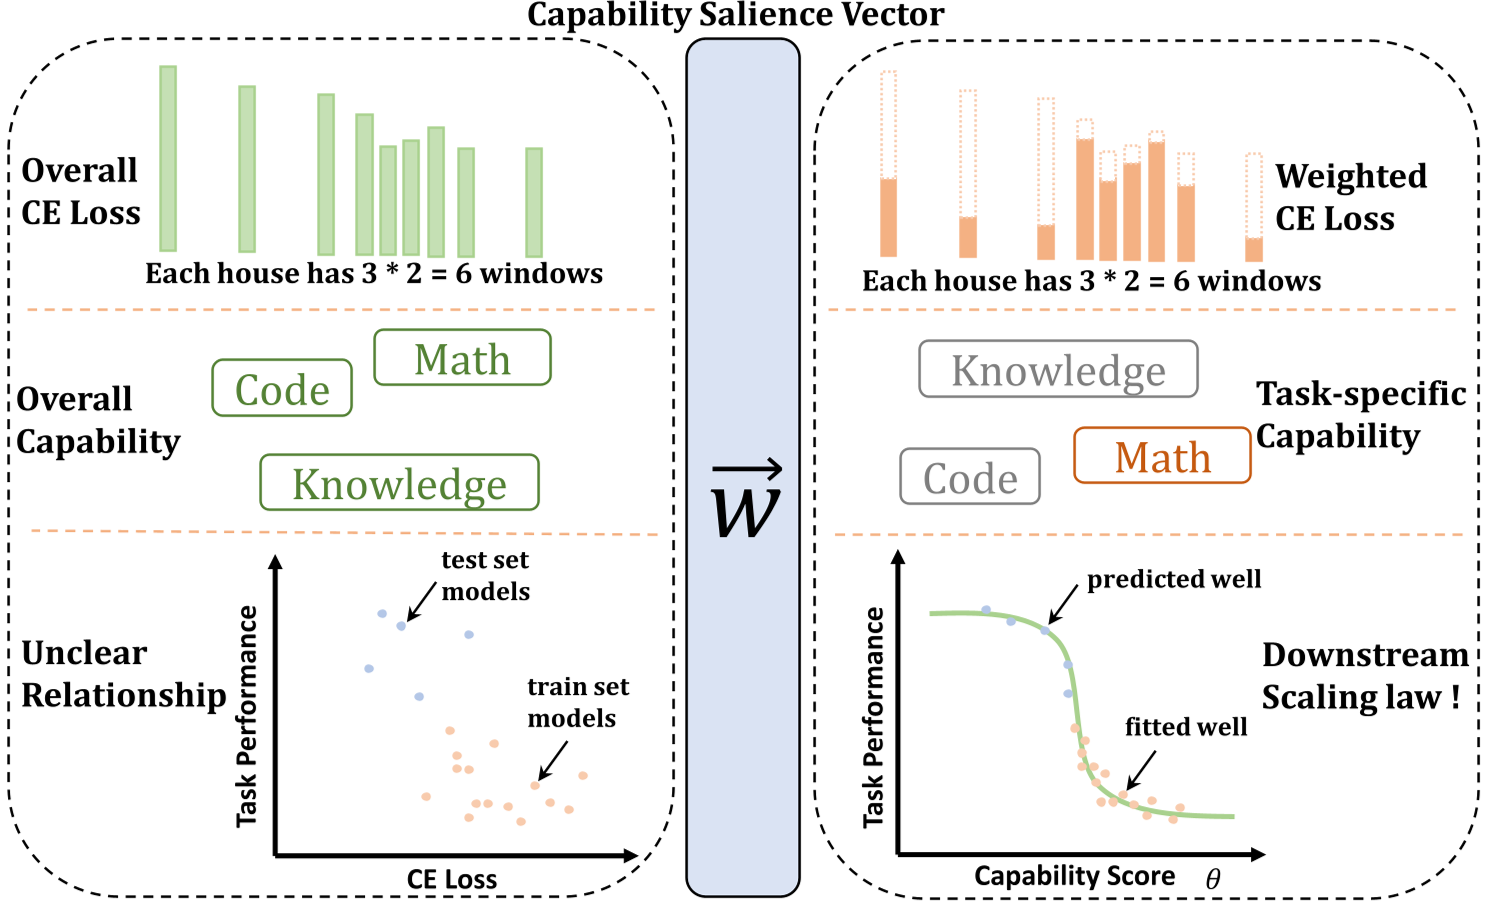 Figure 2: The CSV framework. It identifies which tokens are "salient" for a specific capability, effectively "filtering" the loss.
Experiments & SOTA Results
The authors tested CSV on over 50 open-source models (Llama 2/3, Qwen, Yi, InternLM) and six major benchmarks (MMLU, BBH, GSM8K, etc.).
1. Superior Predictability
Compared to using "All token loss" or "Label token loss" (only weighing the correct answer tokens), CSV achieved significantly lower Mean Squared Error.
| Task | CSV MSE (Ours) | All Token MSE | Label Token MSE |
|---|---|---|---|
| MMLU | 1.45e-3 | 2.40e-2 | 3.31e-2 |
| BBH | 2.26e-3 | 5.81e-2 | 8.27e-2 |
| GSM8K | 6.32e-3 | 7.46e-2 | 9.88e-2 |
2. Generalization to Shifting Distributions
One of the most impressive results is Figure 5, showing that even when models are trained on completely different data ratios, the CSV-weighted loss maintains a clean sigmoidal curve fitting the scaling law.
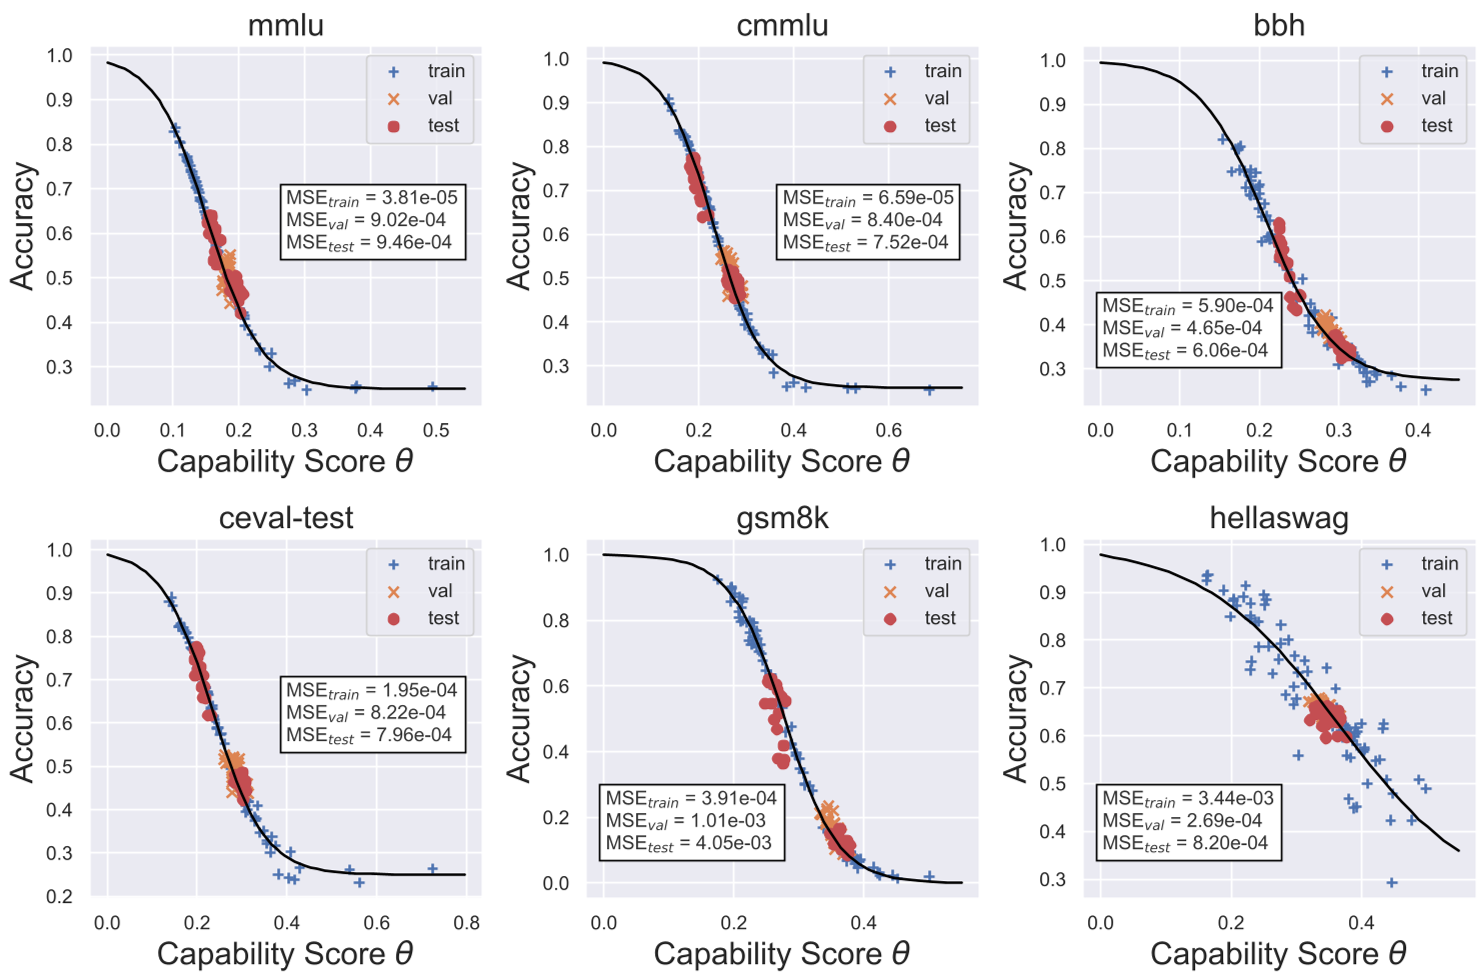 Figure 3: While raw compute/loss is messy, Capability Salience Vector scores align different model series onto a universal, predictable curve.
Visualizing "Salience"
What does the model actually care about? When optimized for the BBH (Reasoning) task, the CSV assigns higher weights to tokens that require contextual synthesis and logical deduction, while ignoring "easy" or "filler" tokens.
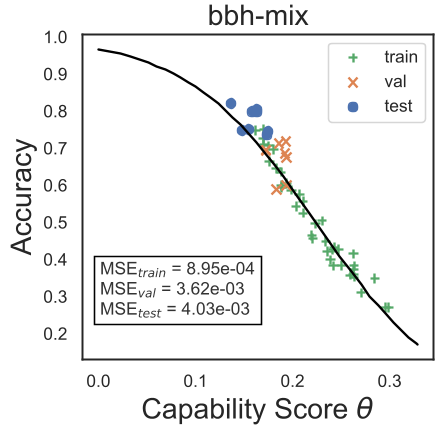 Figure 4: Visualizing importance weights. Green highlights indicate tokens the CSV deemed critical for assessing reasoning capability.
Critical Analysis & Conclusion
The Capability Salience Vector is a significant step toward "interpretable scaling." It moves us away from treating the LLM as a black-box loss-minimizer and toward viewing it as a package of distinct, measurable skills.
Key Takeaways:
- Predicting the Future: Developers can now use early checkpoints (e.g., first 50k steps) to predict if a model will eventually reach a target benchmark score.
- Heterogeneity Matters: All tokens are not created equal. Future training data selection could potentially be guided by CSV weights to prioritize "high-salience" data.
Limitations: The efficiency of the optimization scales with text length, which can be expensive. Furthermore, while it works for objective benchmarks, it remains to be seen if CSV can model more subjective capabilities like "creativity" or "helpfulness."
CSV proves that the "Scaling Law" is alive and well—it just needed a more precise ruler.