
Scaling Social Insights: Capturing Team Dynamics Through Temporal Social Surfaces
Capturing Team Dynamics through Temporal Social Surfaces
The paper introduces Temporal Social Surfaces, a novel visualization technique for capturing group dynamics by plotting Social Network Analysis (SNA) metrics like betweenness centrality over time. Using the TeCFlow system and a sliding time window algorithm, it transforms high-dimensional longitudinal communication data into a single, intuitive 3D-like surface representation.
TL;DR
Understanding how a team evolves is often hidden in thousands of emails and logs. This paper presents TeCFlow, a tool that generates Temporal Social Surfaces—3D-like visualizations that treat social interaction like a weather map. By plotting "betweenness centrality" over time, it allows leaders to "see" team phases, from initial innovation sparks to long-term interest decay.
Positioning: This work bridges the gap between static Social Network Analysis (SNA) and dynamic animation, offering a "gestalt" view of group evolution rather than just a series of disconnected snapshots.
Problem & Motivation: The "Jerky" Data Problem
Most social network tools visualize relationships as nodes and edges. While useful for a single point in time, groups are dynamic. Common approaches—like creating a movie of graphs—suffer from two issues:
- Visual Noise: Graphs that jump and move every second are hard to track.
- Context Loss: Individual plots of "Group Centrality" hide the nuances of who is contributing. Is the whole group active, or just one leader?
The author's insight is to treat social metrics as a continuous surface. Much like a weather-forecasting system, we can observe "high-pressure systems" (intense collaboration) and "impending storms" (conflict or communication breakdown) before they disrupt productivity.
Methodology: The Sliding Time Frame
To create these surfaces, the authors developed the TeCFlow environment, which uses a "Sliding Time Window" to process communication acts (like emails).
1. The Algorithm
The system recalculates the network daily using a window of days.
- With History: Once a tie is formed, it influences the graph forever (dimming out over time). This represents persistent professional relationships.
- No History: Ties exist only within the -day window. This is ideal for tracking immediate activity bursts.
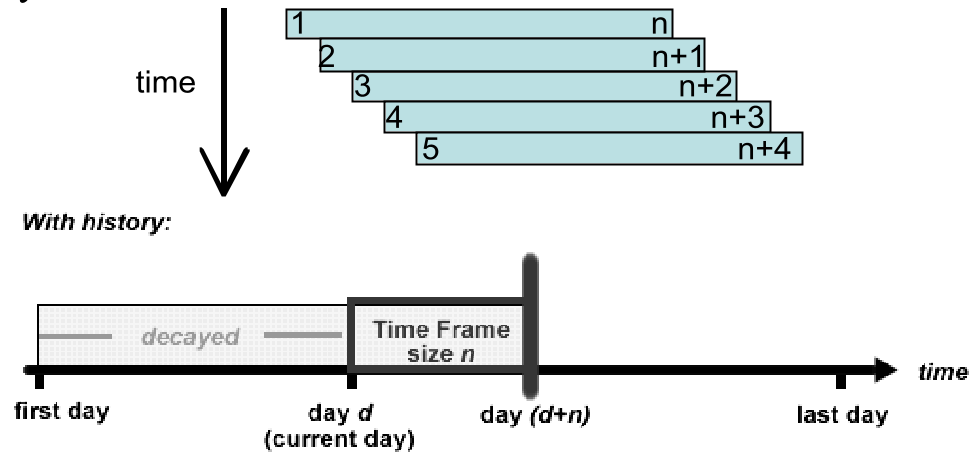 Figure 1: Comparison of the sliding window with and without history.
2. Crafting the Surface
The "Surface" is created by calculating Betweenness Centrality—a measure of how much an individual acts as a "bridge" between others. By sorting these values at every time step and smoothing the result, the team's activity is transformed into a landscape of peaks, plateaus, and valleys.
Experiments: Seeing Innovation and Learning
The authors tested TeCFlow on real-world datasets, including a 200-member global consulting firm and a Webinar organization team.
Case Study: The Innovation Cycle
In the "Innovation" dataset, the Group Betweenness Centrality (GBC) plot showed three distinct peaks. However, the Temporal Social Surface revealed much more:
- The Plateau: A group of ~10 people communicating with low centrality.
- The Spikes: Distinct moments where 5 central members engaged with 20 peripheral people to launch a new service.
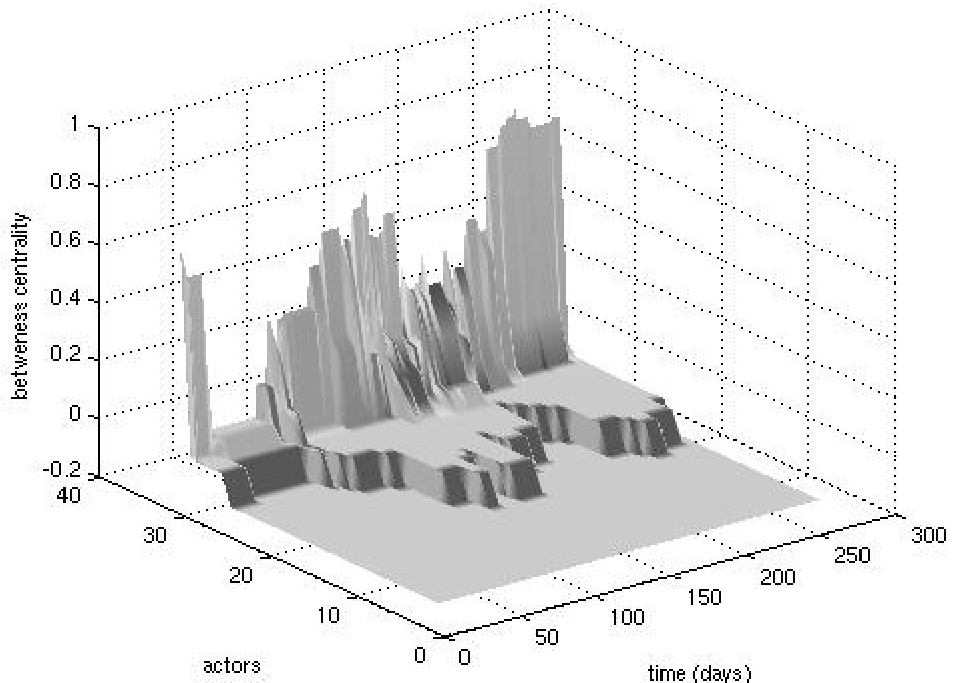 Figure 2: The Temporal Social Surface representing the innovation lifecycle.
Case Study: The "Lurker" Effect
In a "Learning" scenario (Webinar organization), the surface clearly differentiated between the main speaker (the highest peak) and the audience. It identified the "passive lurkers"—those with 0 centrality who were merely recipients of information—placing them on the "base" of the mountain range.
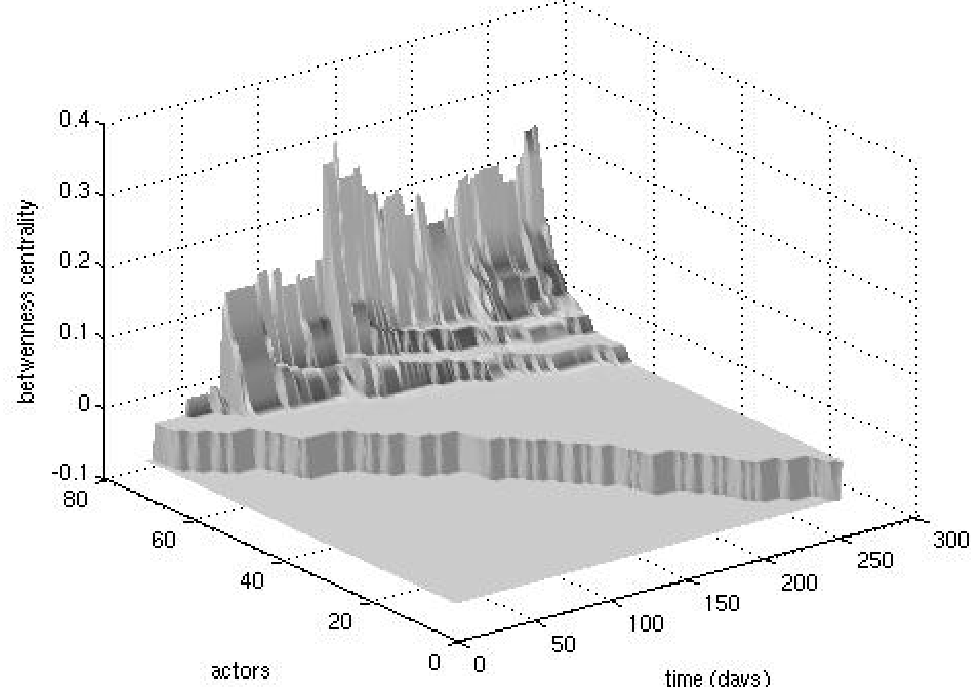 Figure 3: Traditional GBC plot showing activity spikes.
Critical Insight & Conclusion
The true value of the Temporal Social Surface is its ability to compress months of interaction into a single, readable image.
Takeaways:
- Predictive Power: By identifying "elevated planes" of activity, organizations can predict if a project is on track or if engagement is tapering off.
- Role Identification: The system visualizes "Core/Periphery" structures effortlessly.
- Limitations: Sorting values to create a "smooth" surface means we lose the ability to track specific individuals (e.g., "Where is John on this map?"). It provides a group-level health check rather than a per-person audit.
As virtual communities become the standard for knowledge work, tools like TeCFlow will be essential for managers to diagnose "social weather" before a storm hits.