
CCM: Visualizing the Unseen Patterns in Informal Healthcare Data
The care and condition monitor: Designing a tablet based tool for visualizing informal qualitative healthcare data
The Care and Condition Monitor (CCM) is a tablet-based visual analytics tool designed to capture and structure informal, qualitative healthcare data within caregiving teams. It utilizes a circular visualization format and a green/yellow/red voting system to provide a multi-dimensional, longitudinal view of a patient's status and care goals.
TL;DR
The Care and Condition Monitor (CCM) is an innovative tablet-based tool that shifts the focus of medical records from purely formal diagnostics to the rich, qualitative insights of frontline caregivers. By using a circular visualization and a simple voting mechanism, it transforms informal observations into a structured, longitudinal map of a patient’s well-being.
Context & Motivation: The Gap in the Medical Record
In long-term care facilities, a patient’s "condition" isn't just a set of vitals; it’s reflected in subtle cues—a change in morale, a slight decrease in mobility, or a moment of cognitive clarity. Currently, these "informal" data points are shared during shift changes or via private messaging, often escaping the formal Electronic Medical Record (EMR).
The authors argue that the problem with current EMRs is twofold:
- Information Overload: They are text-heavy and difficult to scan quickly.
- Narrow Scope: They ignore the collaborative and qualitative nature of care, leading to a fragmented view of the resident.
Methodology: The Geometry of Care
CCM introduces a design language rooted in Social Translucence and Spatial Reasoning. Instead of tables and lists, it uses a circular interface to represent the "Circle of Care."
1. Simple Voting Strategy
To minimize cognitive load, the system uses a green/yellow/red voting system. Caregivers vote on five core metrics: General Health, Morale, Cognition, Mobility, and Form. These are not complex medical entries but "gut checks" that, when aggregated, provide a statistically significant reflection of a patient's trajectory.
2. The Circular Visualization
As shown in the architecture, the interface uses space to denote relationships:
- The Hub: A large central dot represents the overall status.
- The Perimeter: Metric types and individual caregivers are mapped on one side, while status states are on the other.
- The Trajectory: A "tail" behind the status dot indicates past positions, giving an immediate sense of volatility or improvement.
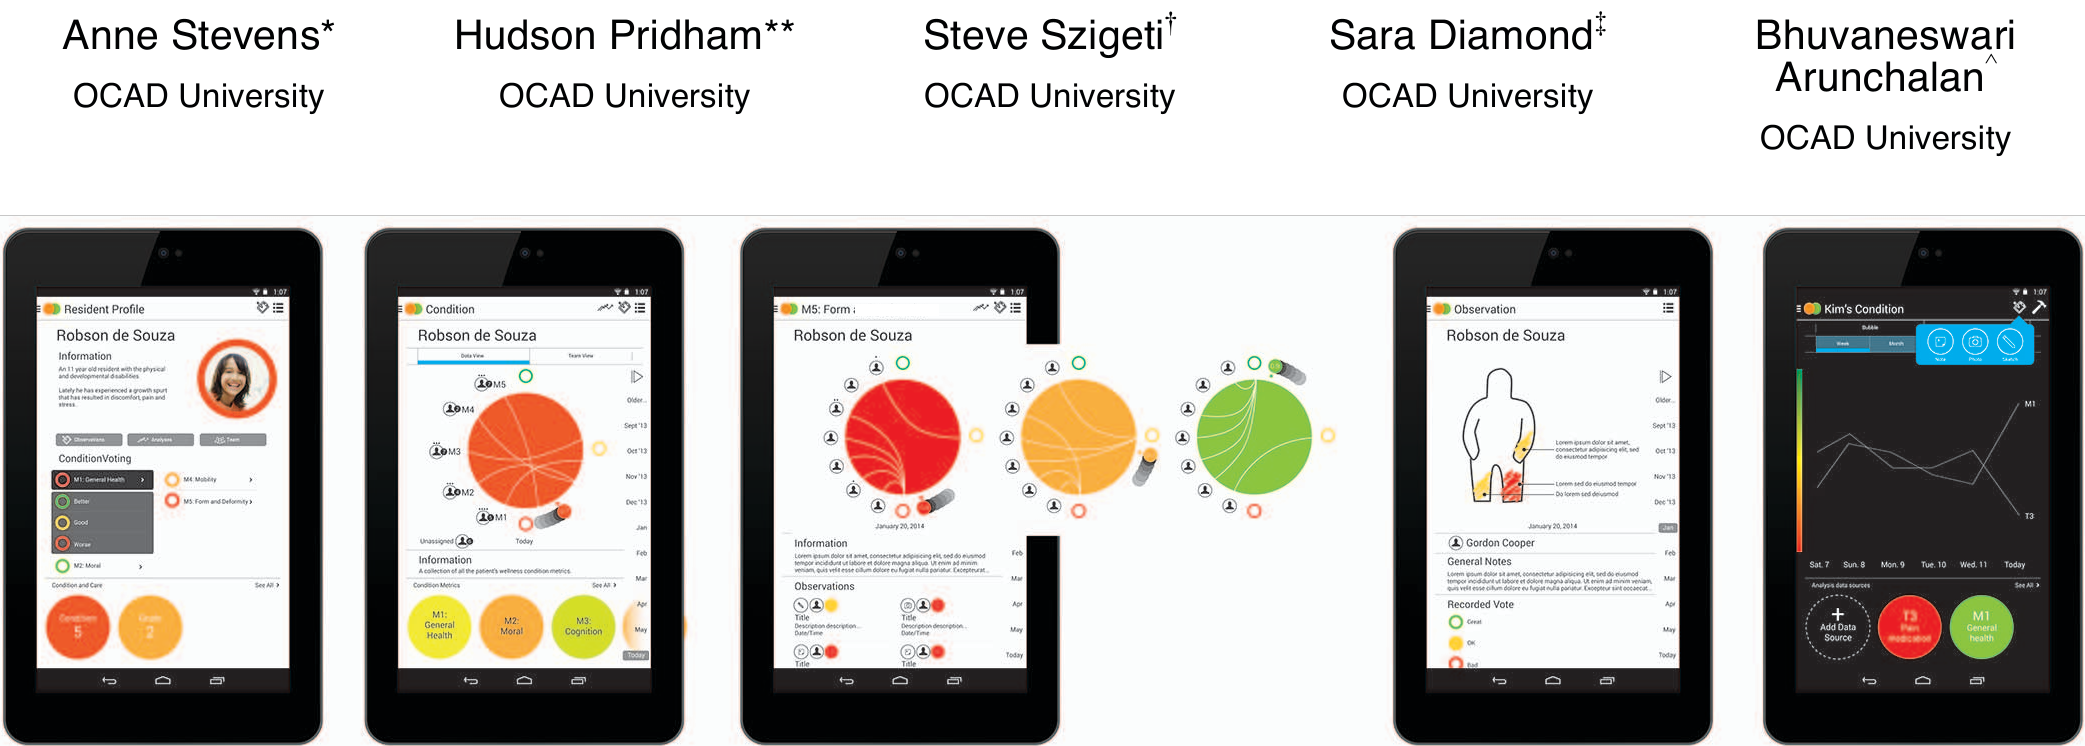 Figure 1: (a) Voting page; (b) Circular visualization showing metrics and caregivers; (c) Longitudinal changes; (e) Comparative analysis tool.
Analysis and Results: Beyond the Surface
The CCM isn't just a dashboard; it’s an analytical engine. One of its most powerful features is the Analysis Mode (viewable in Fig 1e), which allows clinicians to correlate different data streams. For instance, a doctor can compare "Care Goals" (what the staff is doing) against "Condition Metrics" (how the patient is responding) to see if a specific therapy is actually working.
Key UX Successes:
- Redundant Coding: By using color, spatial positioning on a -1.0 to +1.0 scale, and numerical values, the system remains fully accessible to color-blind users.
- Accountability: Every data point is linked to a caregiver, fostering a sense of community and responsibility within the team.
Critical Insight & Future Outlook
The brilliance of CCM lies in its Inductive Bias—the assumption that the collective "feeling" of a care team is a valid data source. By formalizing the informal, it provides a "human-in-the-loop" surveillance system for long-term health.
However, the work is still a work-in-progress. The authors acknowledge potential hurdles like voter fatigue (where caregivers stop voting due to repetition) and the need for vote weighting (should a chief physician's vote count more than an assistant's?).
Conclusion
CCM proves that healthcare technology doesn't always need more sensors; sometimes, it just needs better ways to capture the human observations that are already there. It moves us toward a future where "data" is as holistic as the care it represents.
Keywords: Health Informatics, Visual Analytics, Qualitative Data, Interaction Design.